The $200 billion quarter: big tech now spends more than its businesses bring in
Alphabet, Amazon, Meta and Microsoft spent $202 billion on capital projects in the quarter, more than double a year earlier, and their combined free cash flow turned negative. Most other stocks rose.
Big tech sold off this week as the quarterly results came in. The headlines said "AI fears". The results releases say something more specific: the four largest cloud companies are now spending more on building than their businesses bring in.
The numbers
Alphabet, Amazon, Meta and Microsoft all reported this week (Meta on October 21). Each figure below is the July to September quarter, against the same quarter a year earlier, as printed in each company's results release.
Capital spending, mostly data centres, chips and the power to run them:
- Amazon: $77.3 billion, up from $35.1 billion
- Alphabet: $51.4 billion, up from $24.0 billion
- Microsoft: $39.4 billion, up from $19.4 billion
- Meta: $33.9 billion, up from $18.8 billion
- Together: $202 billion, up from $97 billion. More than double in a year.
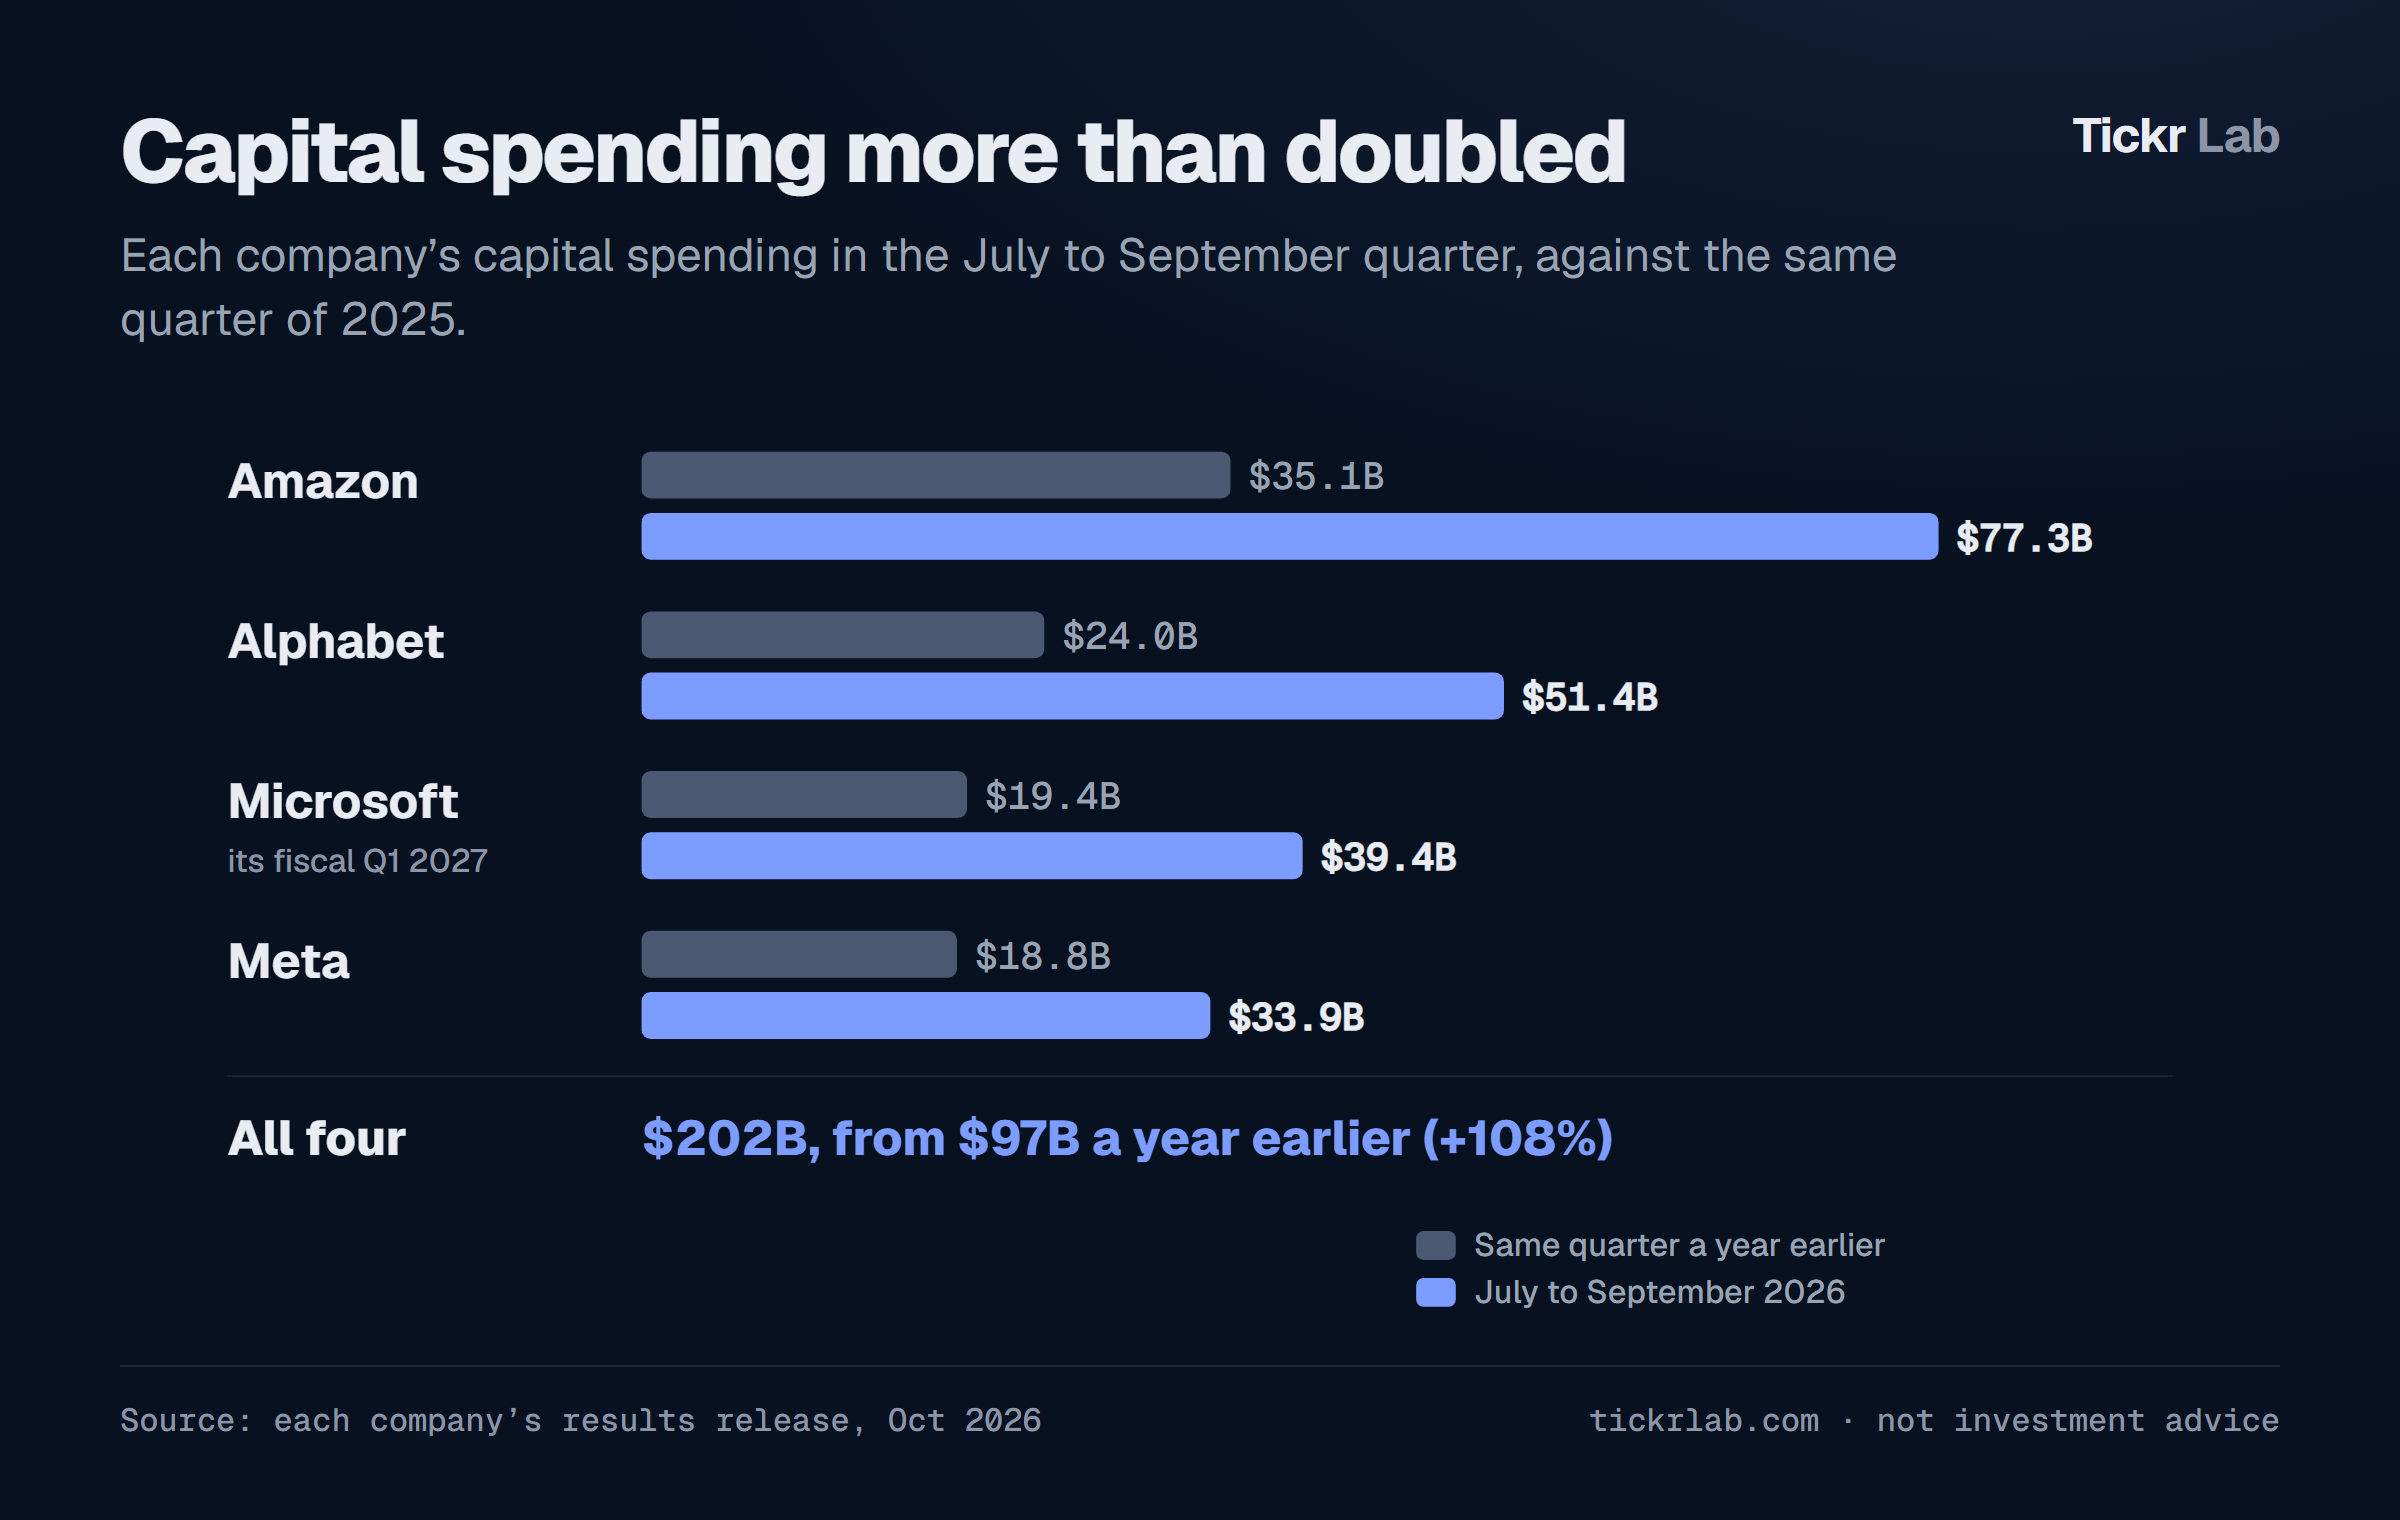
In this chart: Amazon · Alphabet · Microsoft · Meta
Free cash flow, the cash left over after that spending:
- Amazon: minus $34.8 billion, from plus $0.4 billion
- Alphabet: minus $9.1 billion, from plus $24.5 billion
- Meta: minus $2.1 billion, from plus $10.6 billion
- Microsoft: plus $18.6 billion, from plus $25.7 billion
- Together: minus $27 billion, from plus $61 billion.
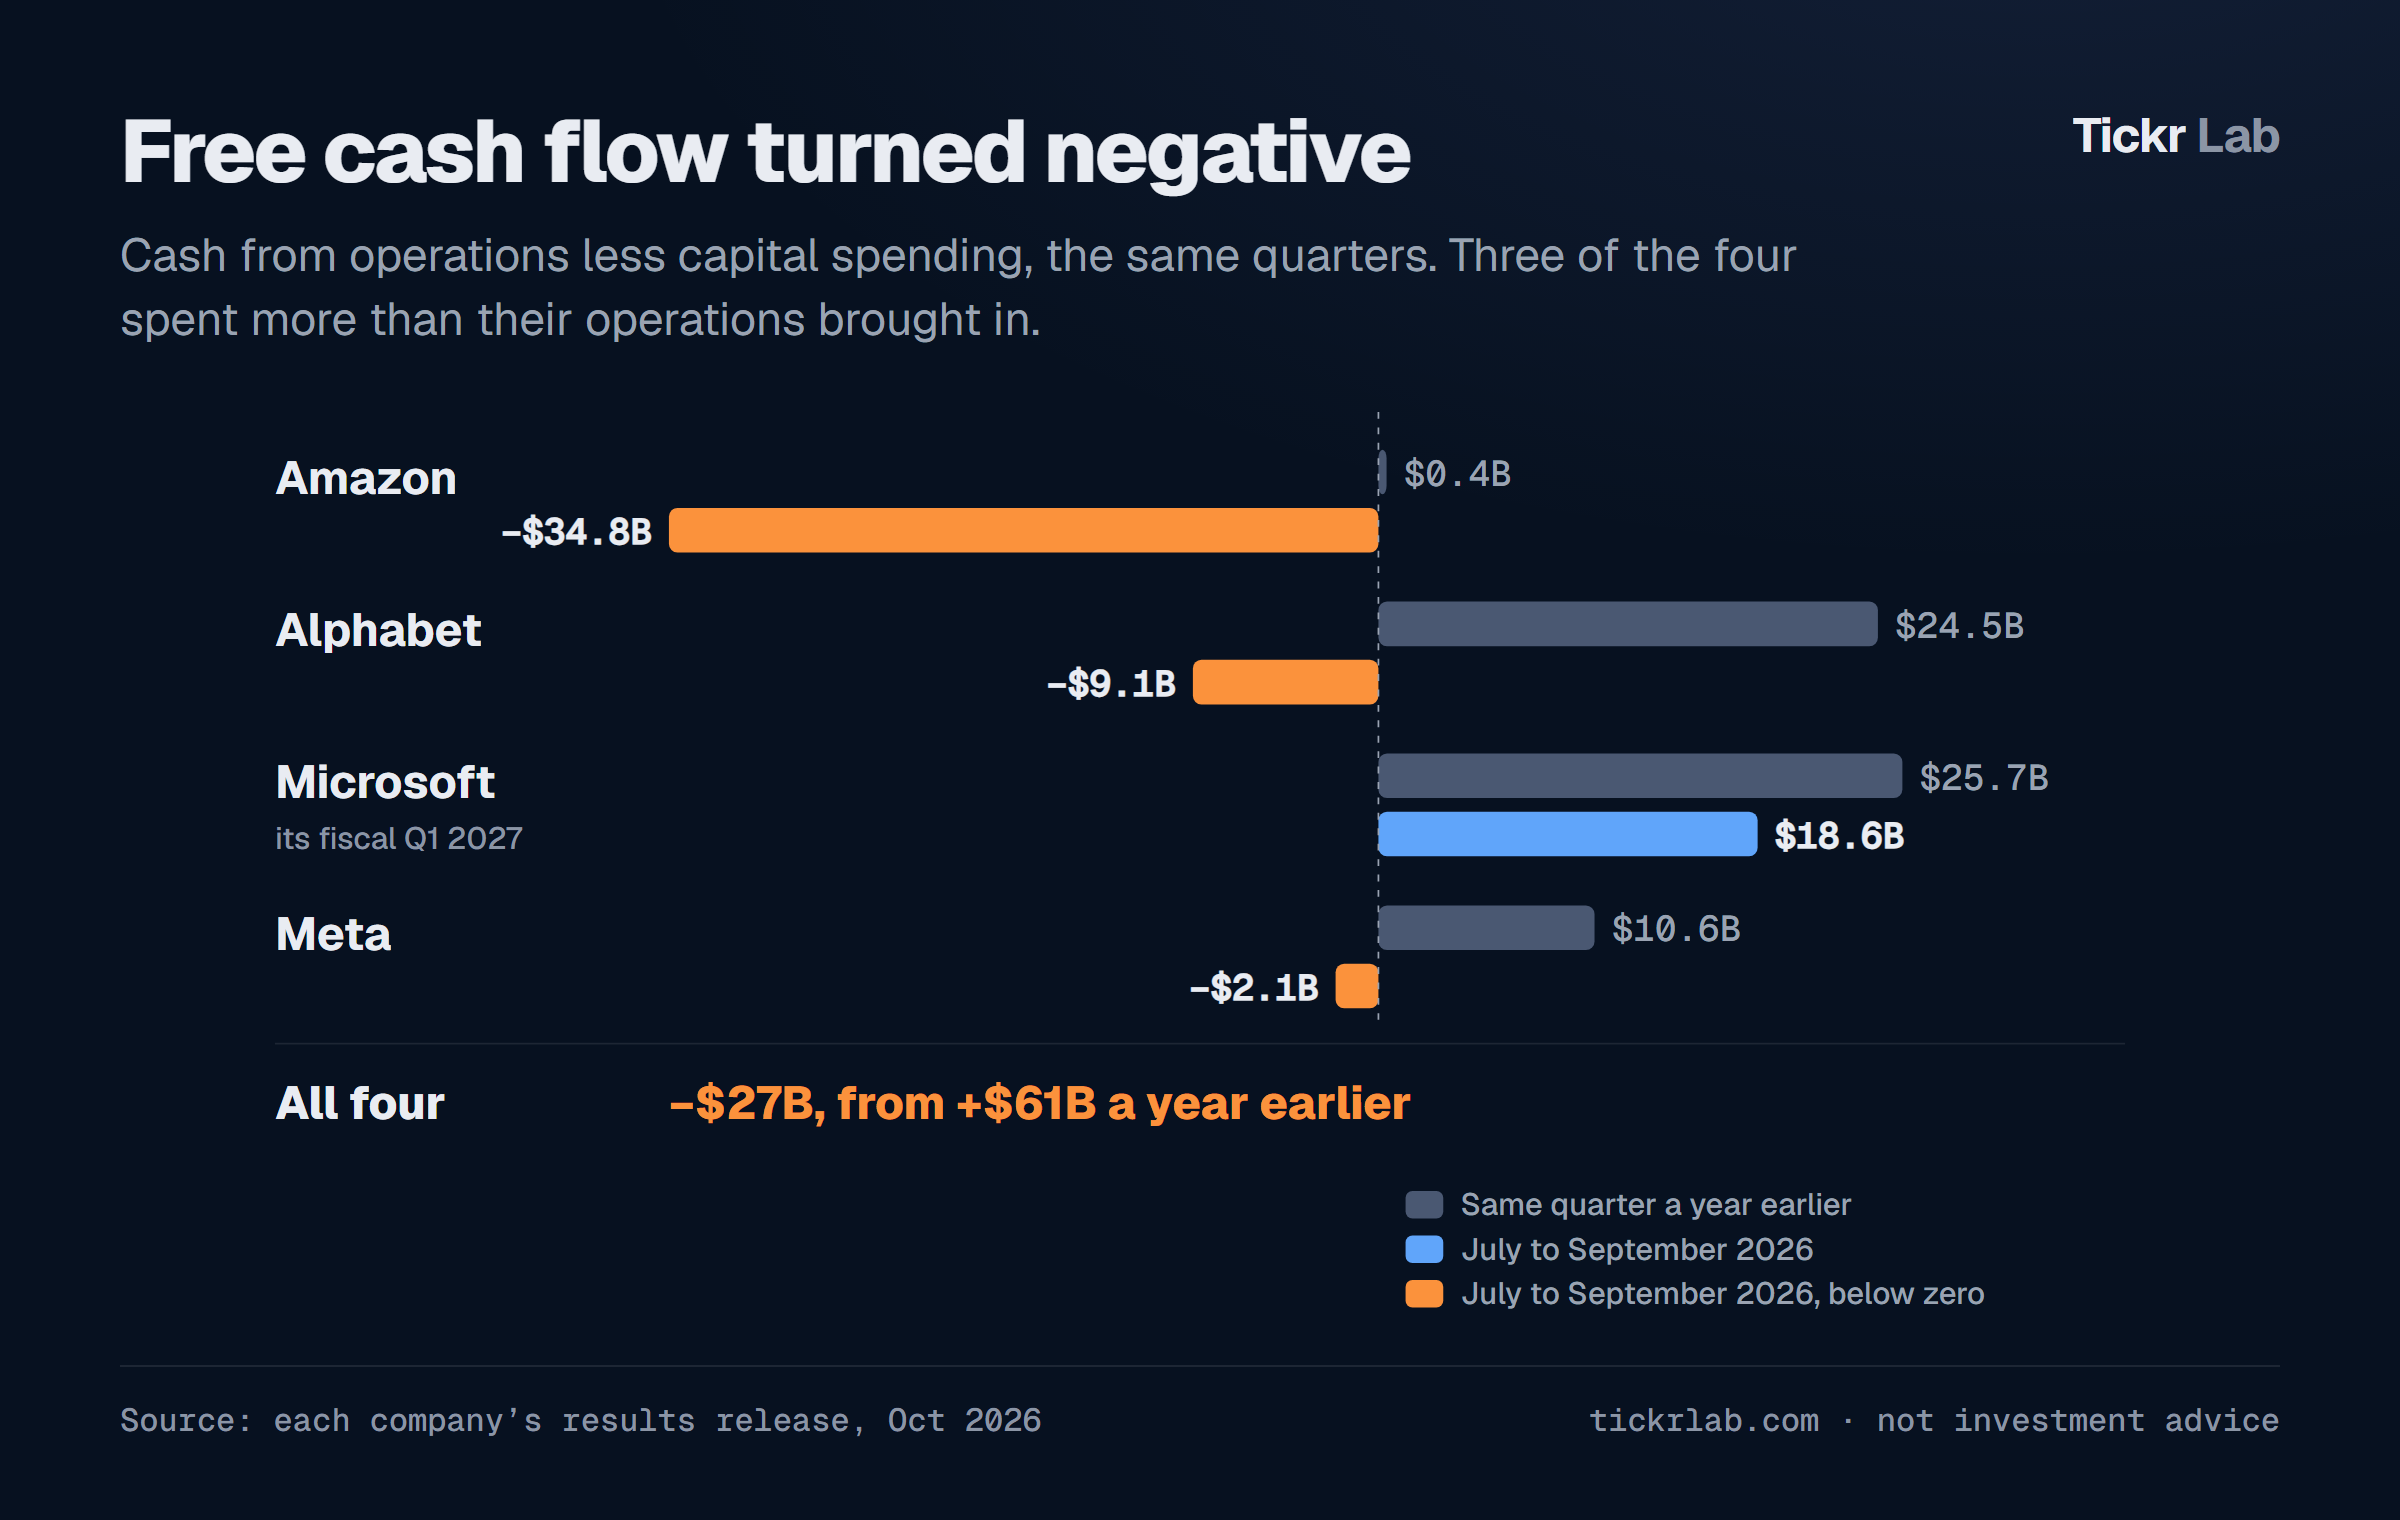
In this chart: Amazon · Alphabet · Microsoft · Meta
The businesses themselves kept growing. Revenue across the four rose 18%, and the cash their operations brought in rose 10%, to $176 billion. The spending simply grew faster. A year ago these four put 61 cents of every operating dollar back into capital spending. This quarter it was $1.15.
How the shares took it
For the week, from the close on October 23 to the close on October 30:
- Alphabet: down 12.6%, almost all of it on Thursday, the day after its results
- Meta: down 4.4%
- Amazon: down 3.1%
- Microsoft: down 0.5%
Alphabet's fall on Thursday was its largest one-day drop in the price history we hold, which goes back to 2006. The two next largest were in March 2020 and September 2008.
The rest of the market went up
Here is the part the index headlines missed. Of the 1,283 stocks and funds we track, 782 rose this week. The median one gained 1.2%. The Nasdaq 100 fund QQQ fell 2.0% and the S&P 500 fund SPY fell 0.6%, because the largest companies weigh the most in both.
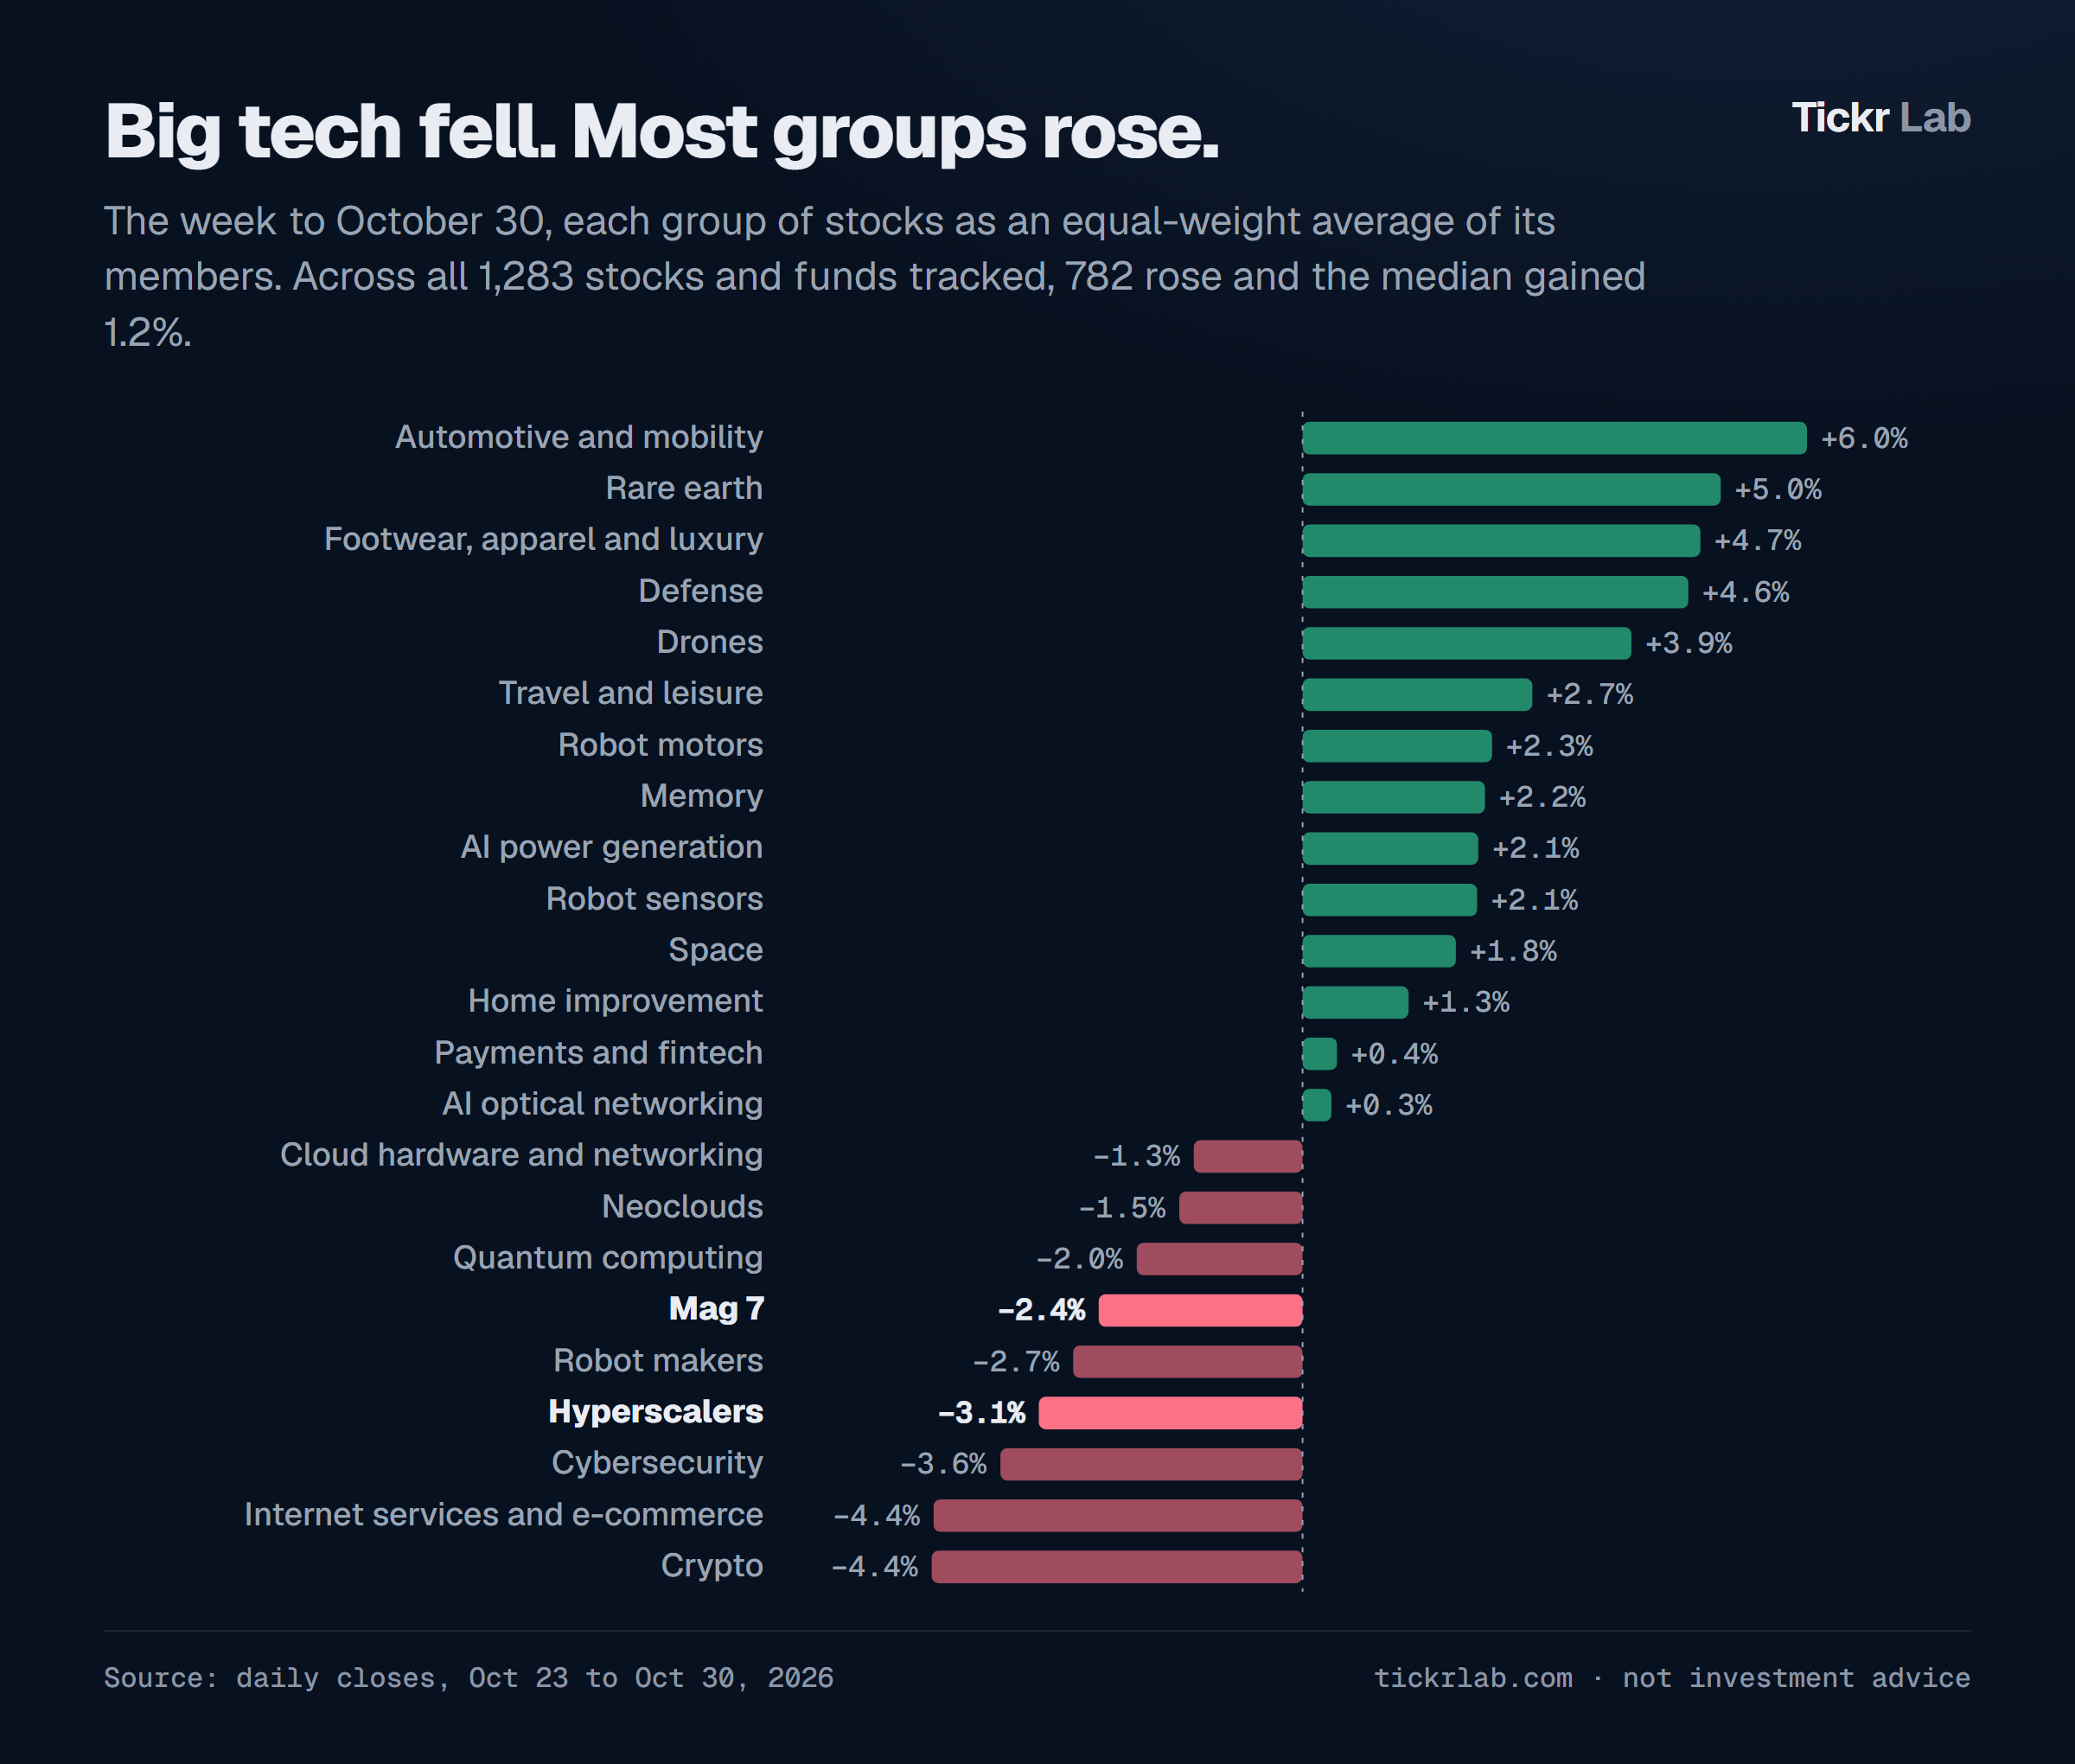
The groups that rose most were Automotive and Mobility (up 6.0% on average), Rare Earth (5.0%) and Defense (4.6%).
And some of the companies on the receiving end of that $202 billion held up. Memory makers rose 2.2% on average, and the companies that generate power for AI data centres rose 2.1%. One company's capital spending is another company's revenue.
What this is, and what it is not
This is a description of what four companies reported and how their shares moved in one week. It is not a forecast of what happens next and it is not a view on whether any of these shares is worth owning. Spending more than you bring in can be a deliberate choice for a company with a large balance sheet; whether it pays off is a question for later results, not for this one.
Every figure here comes from the companies' own results releases and from daily closing prices, as stored in Tickr Lab on October 30, 2026. Weekly group figures are equal-weight averages of each group's members.