Every US stock, measured the same way after every close.
A screener, a page for every company and post-ready visuals, for people who follow US stocks and for the people who write about them. Returns, trend, company filings, who owns it, and a plain reading of where each stock stands, all in one place.
Free during the beta. No card asked for. Paid plans come later, for research, backtesting and AI.
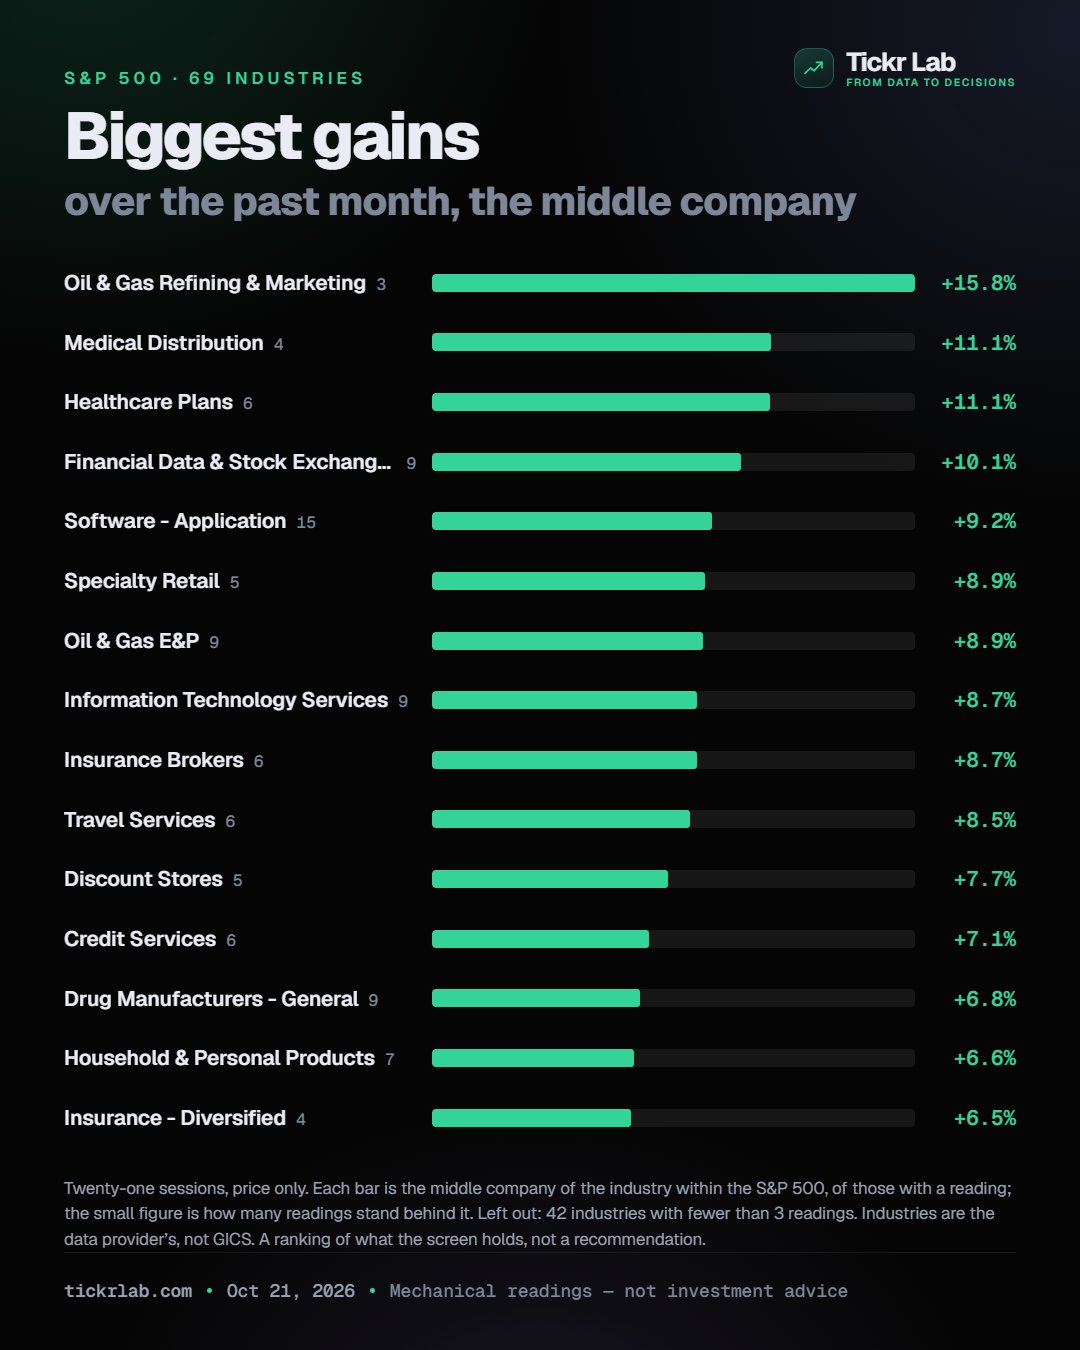
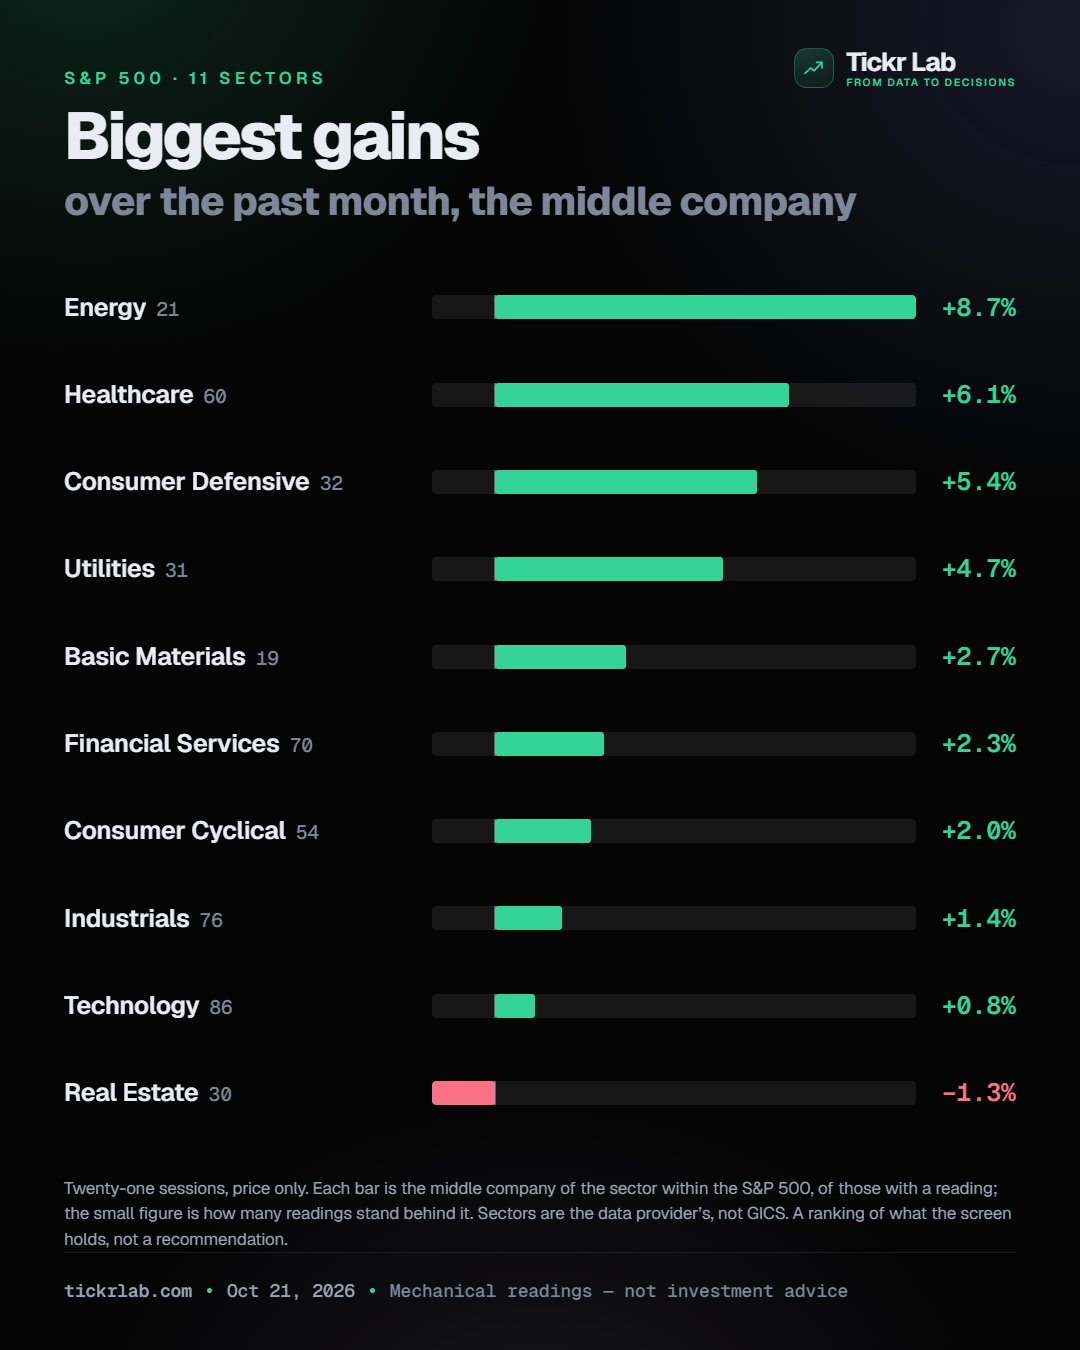
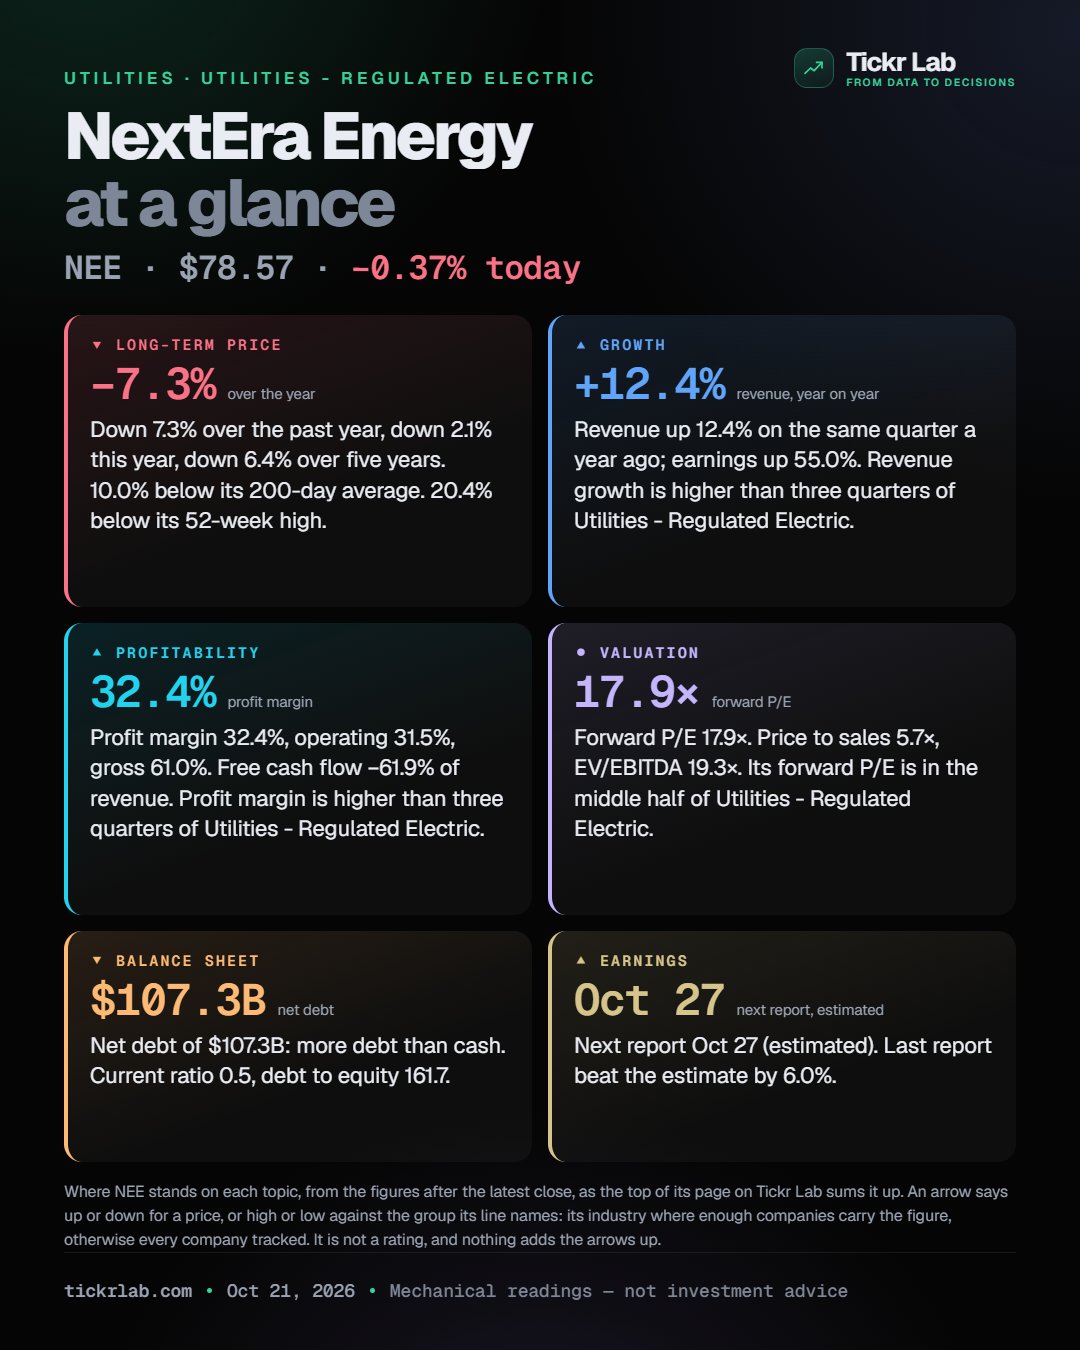
Real cards from the visuals studio, made from the close of October 21, 2026.
Seven stocks, one year, drawn day by day.
The Magnificent 7's share prices from October 28, 2025 to October 29, 2026, each line rebased to where it started. Made in Tickr Lab's visuals studio from the stored daily closes, as a video ready to post.
Price return only. A record of what happened, not a forecast.
Three kinds of people use it.
Follow US stocks without twenty open tabs.
One table for the whole market, a page for every company, and a reason behind every number.
- Screen 1,282 stocks on returns, trend, valuation, growth, margins and ownership
- Click any number to see its history
- Alerts, saved screens and paper positions to try an idea with pretend money
Post-ready market visuals, made from tonight's data.
Pick a card, choose a size, download. Every card carries its date and a not-advice line.
- Dozens of cards for the market, sectors, industries, themes and single stocks
- Instagram sizes: feed, square and story, in Dark, Navy or Light
Custom access for a project, a thesis or a hunch.
Years of daily prices, company filings and AI-read news and results, already joined up. Tell us what you are working on and we will set up access for it.
- Backtest an idea against the stored history
- Download data sets we build ourselves from public filings and AI reading
- Build new visualizations from the same data as the cards
- Work through new trading ideas with us, and test them before trusting them
Write to support@tickrlab.com with a line about your project.
What you get on day one.
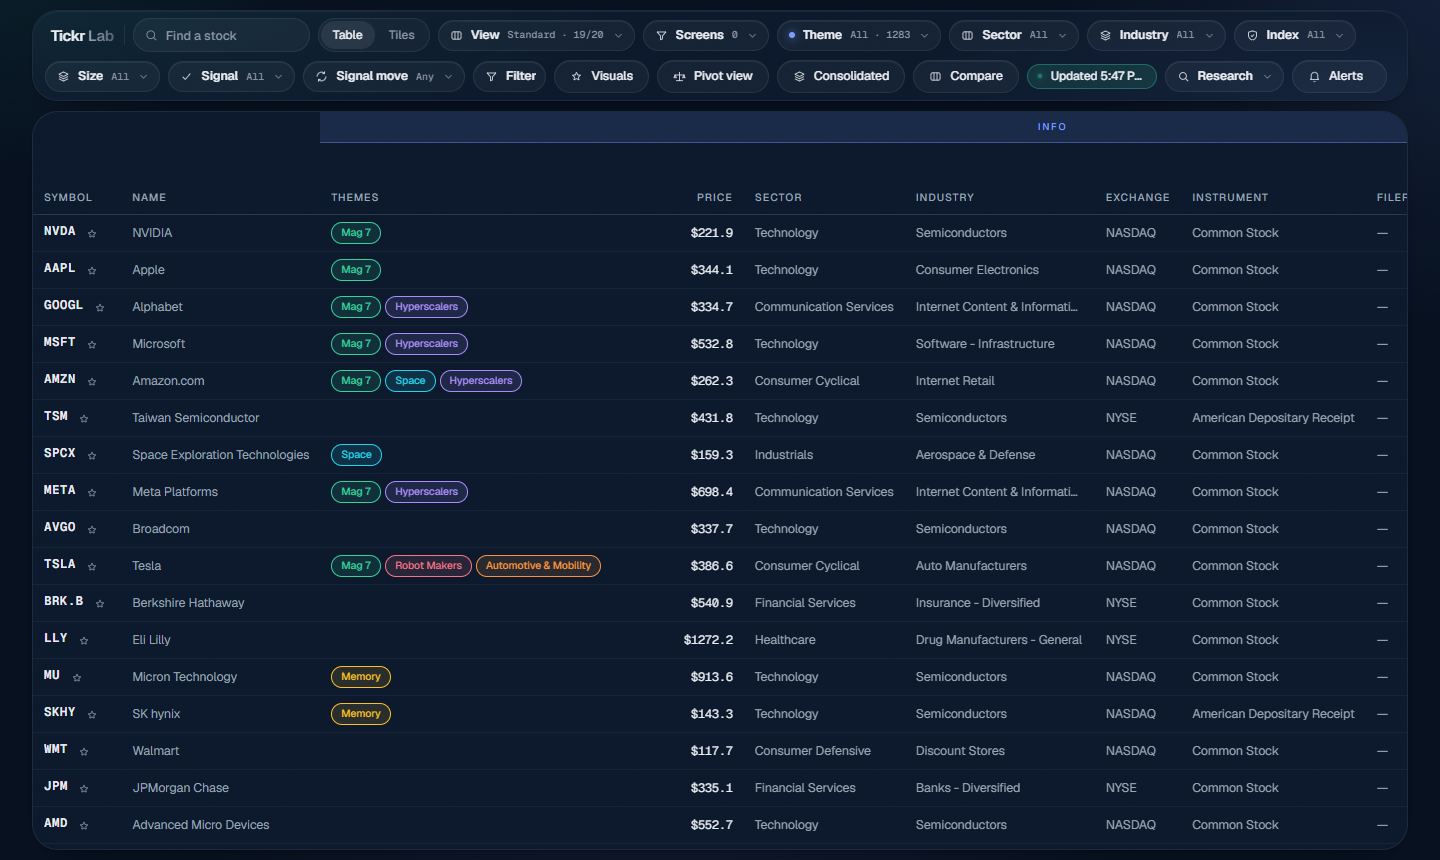
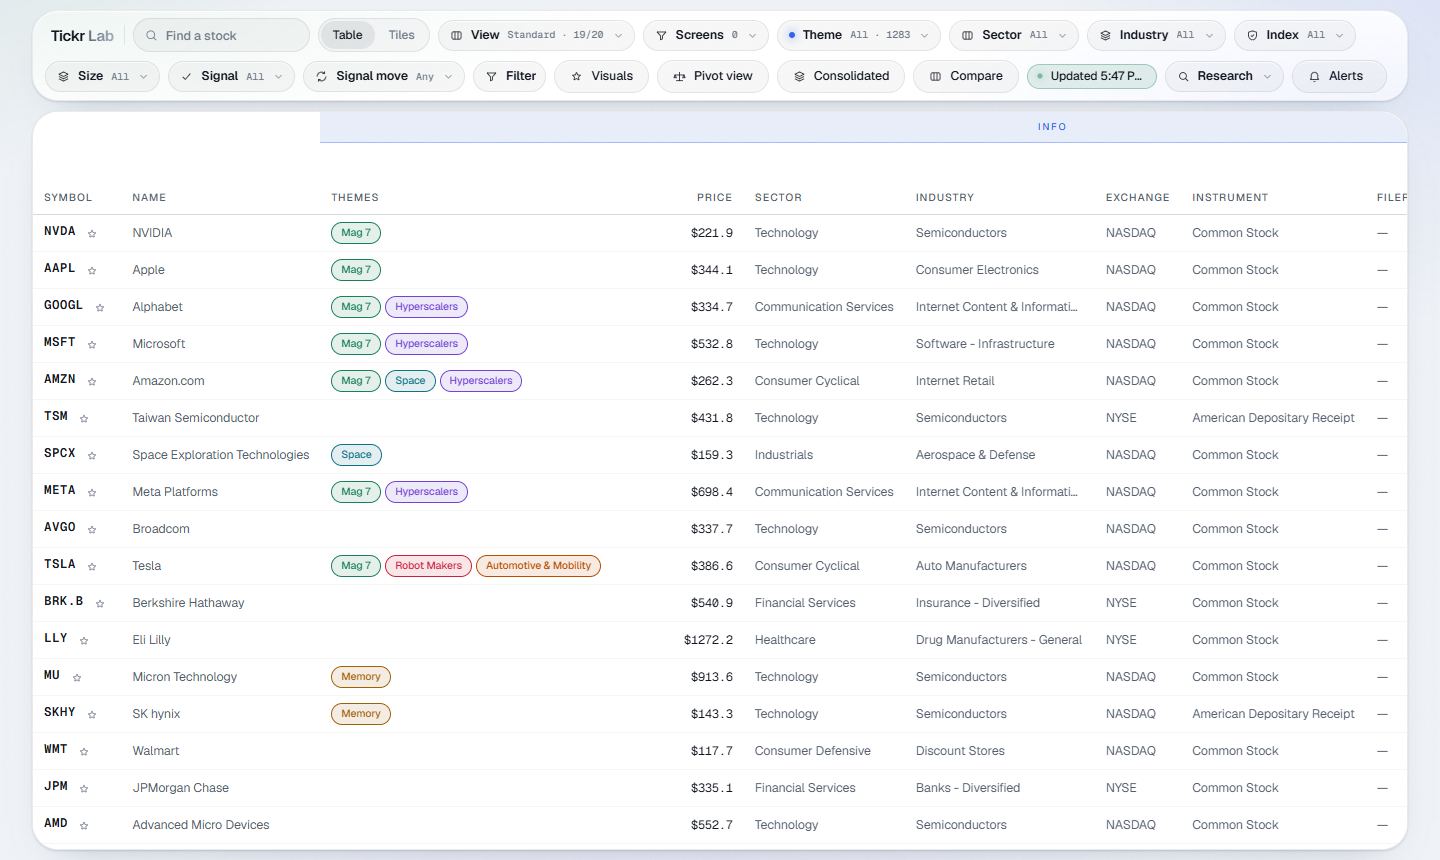
One table, every stock, measured nightly.
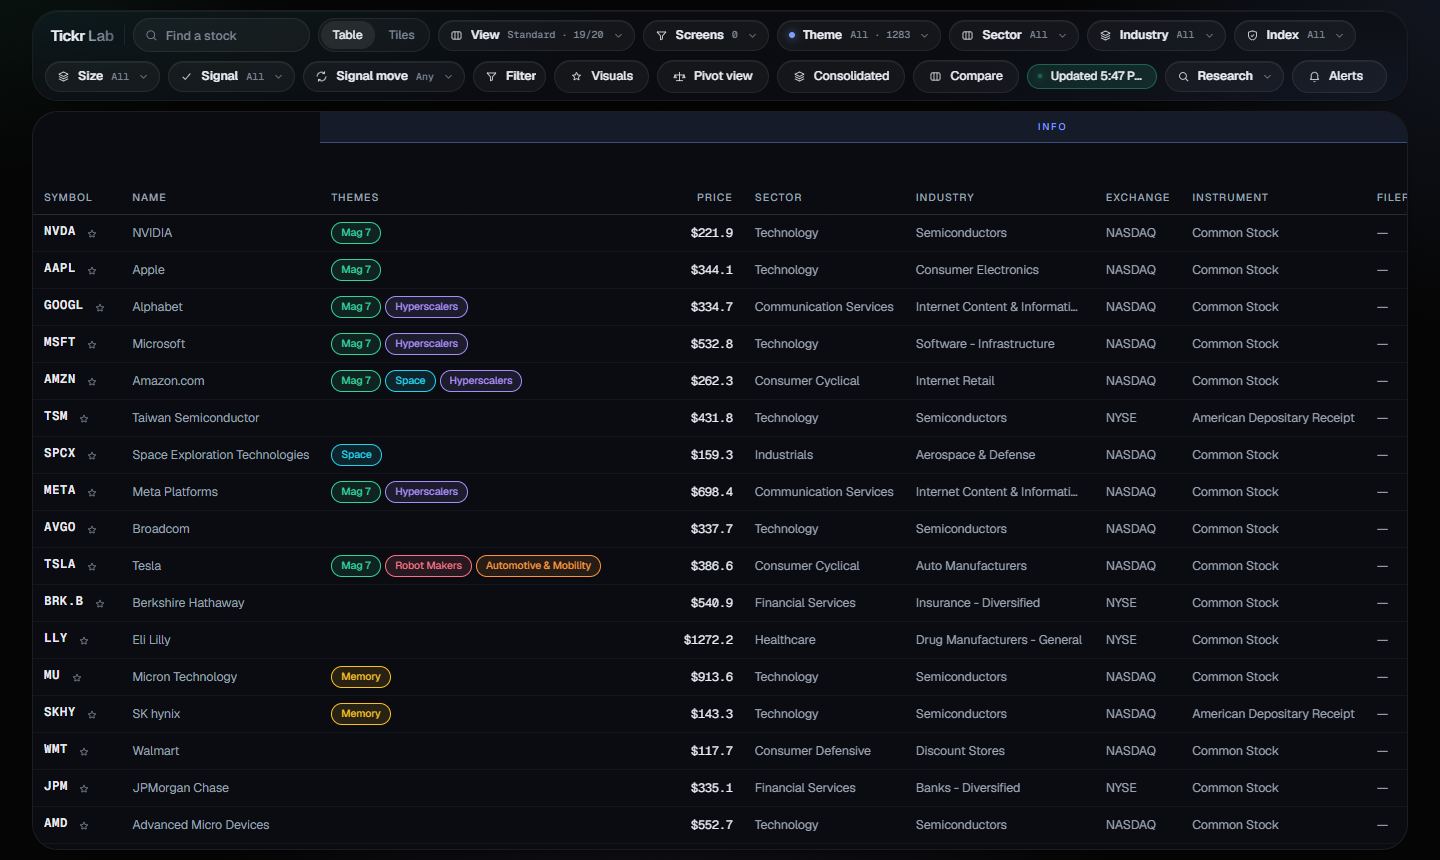
167 columns, grouped by what they answer: how it moved, where it sits, what the business earns, who owns it, what the news says.
- Filter on any column; 33 ready-made screens
- A Signal on every row, with the one rule that produced it
- Tiles for the phone
| Stock | Today | 1M | 1Y | Fwd P/E | Signal |
|---|
Four of the guest-preview stocks, from the latest close.
A page for every company.
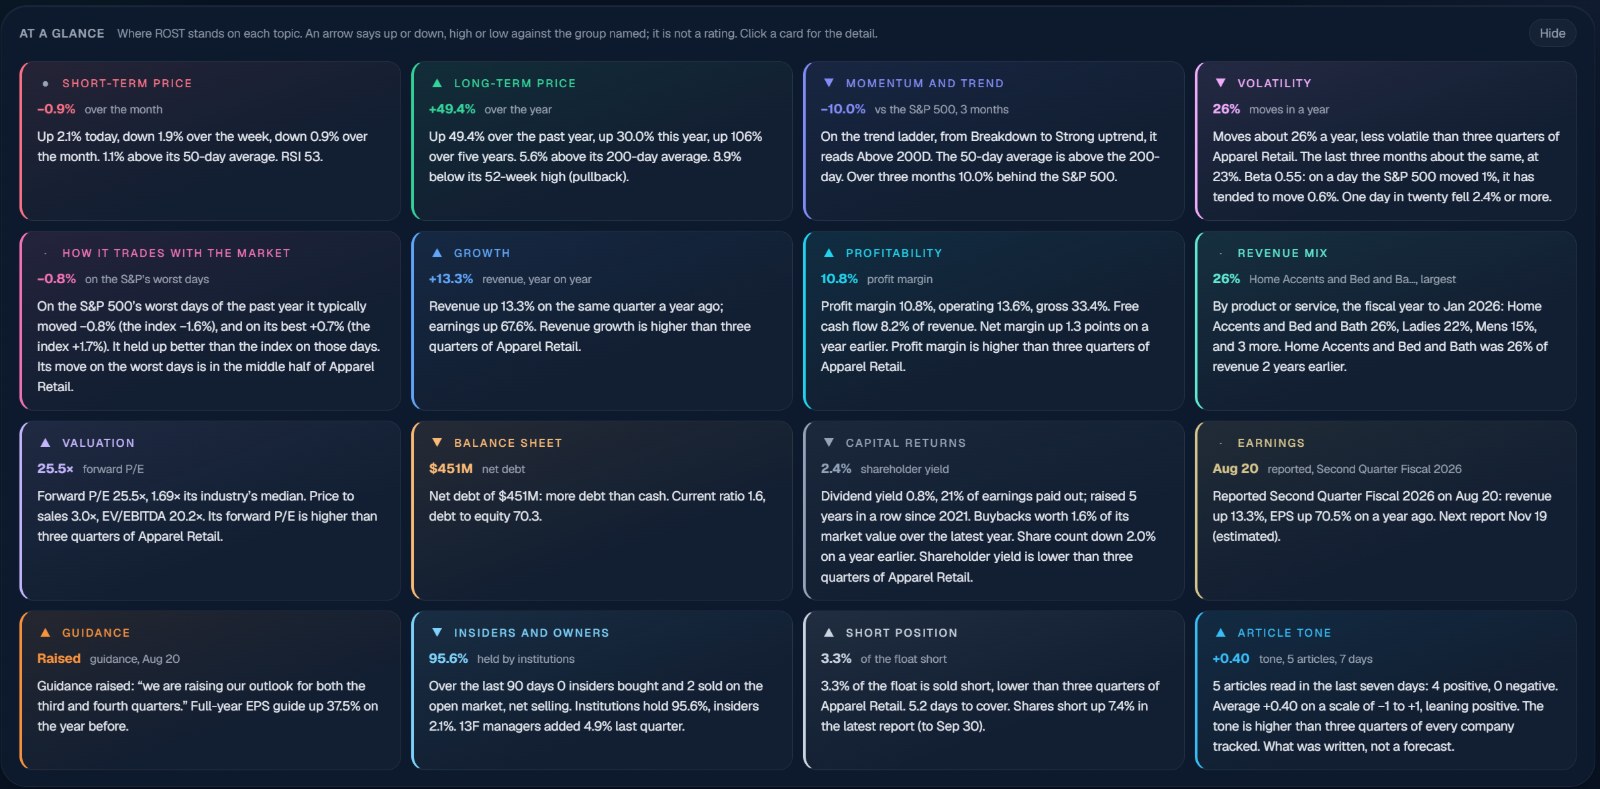
At a glance cards up top, then the chart, the filings, earnings, insiders, institutions, funds, short interest, options and news.
- Each topic in a sentence, with its headline number
- Compared against the company's own industry
- Article tone: an AI reading of each news article, for the S&P 500
The market two ways at once.
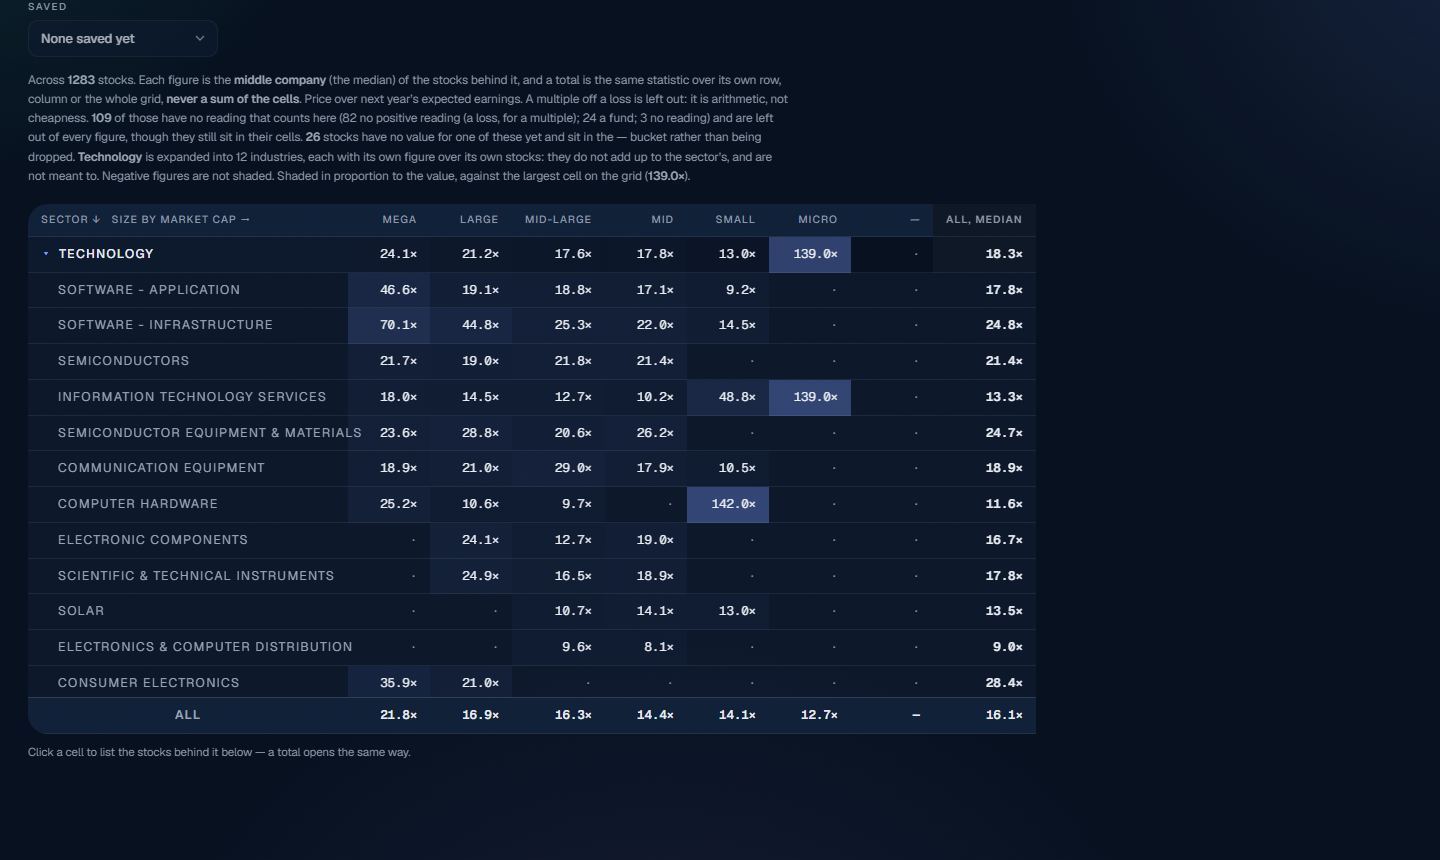
Sector against size, theme against trend, industry against index. Each cell opens the stocks behind it.
- 28 measures: returns, valuation, margins, growth, ownership
- Each cell is the middle company, so one outlier cannot lead
- Months or years across the top for returns over time
Cards for social posts.
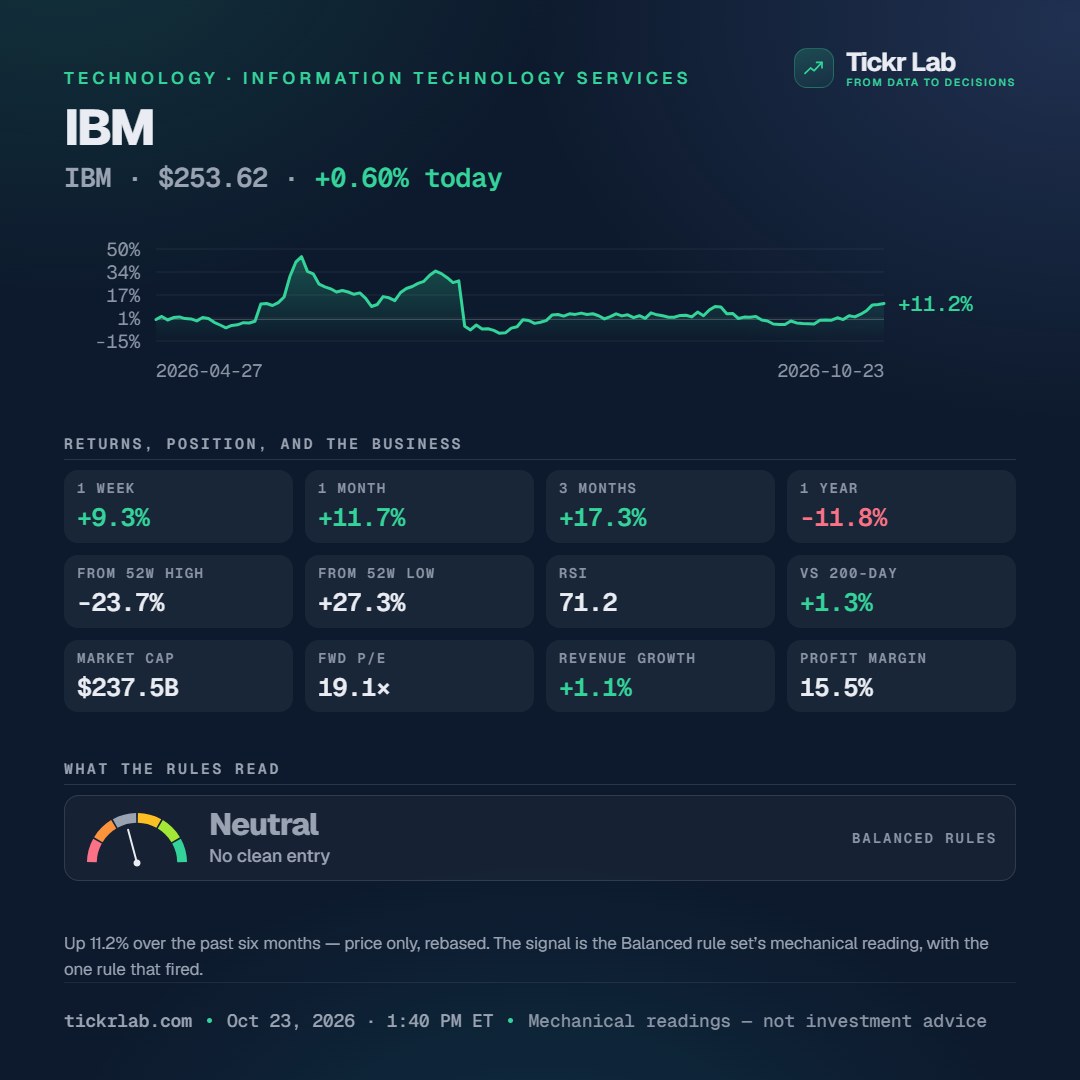
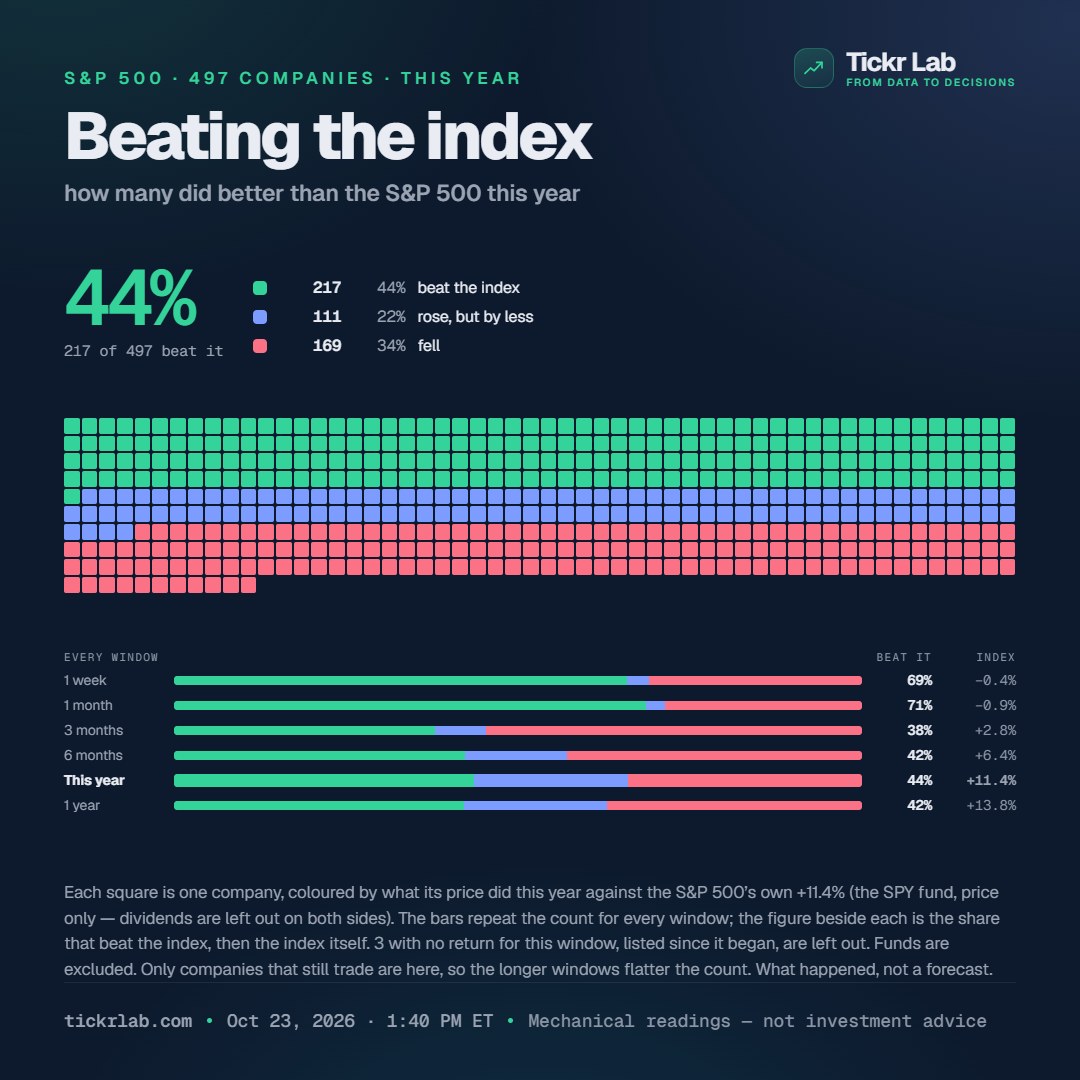
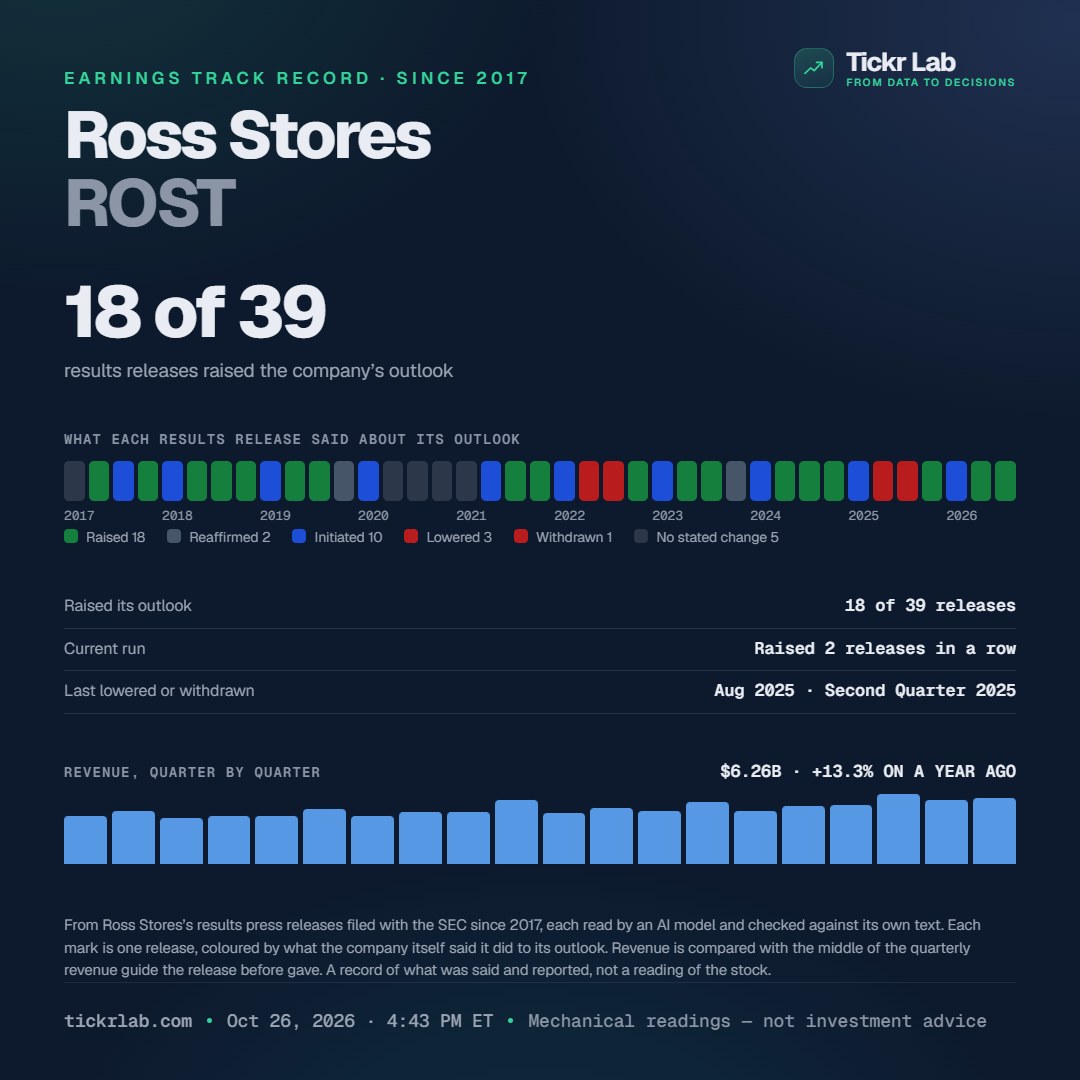
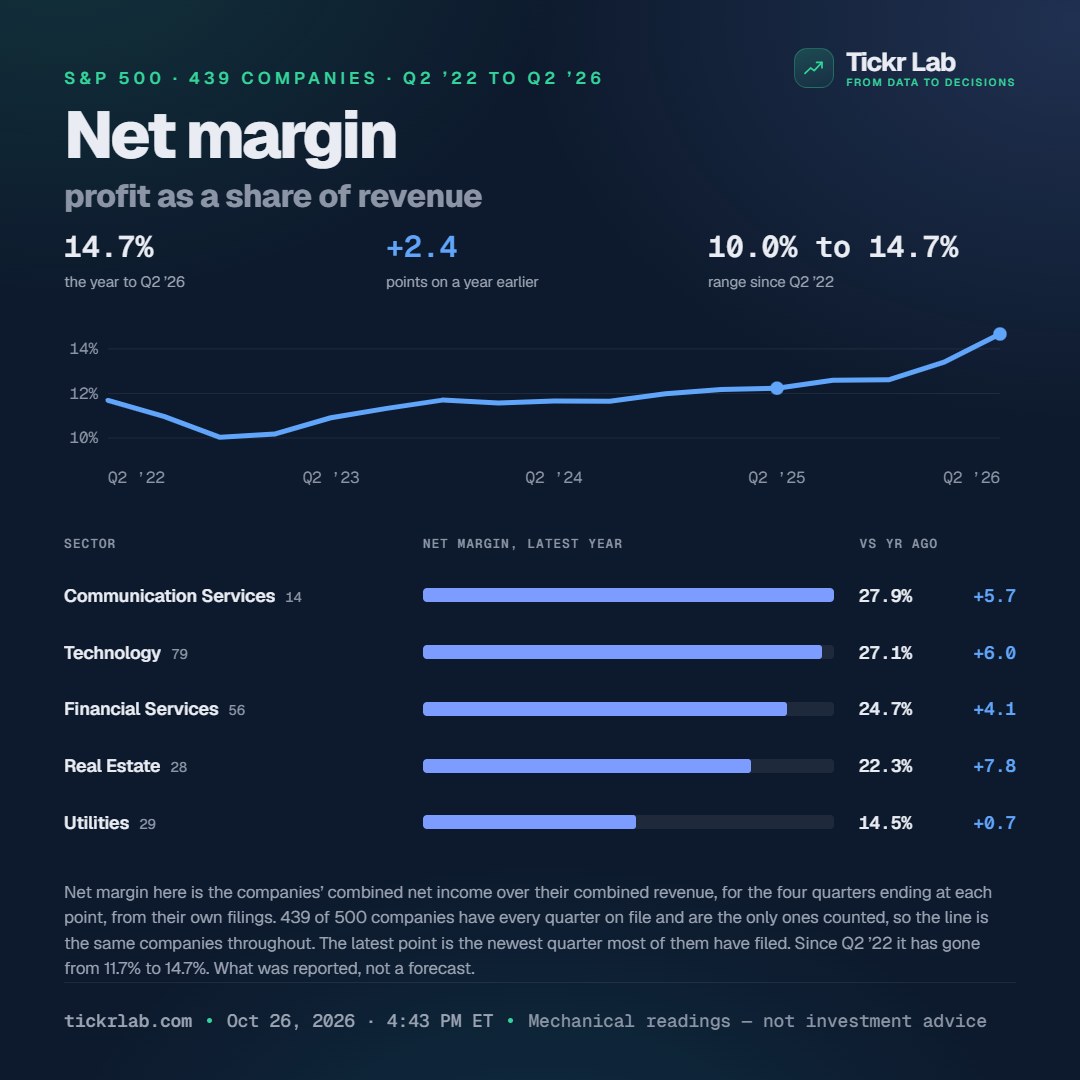
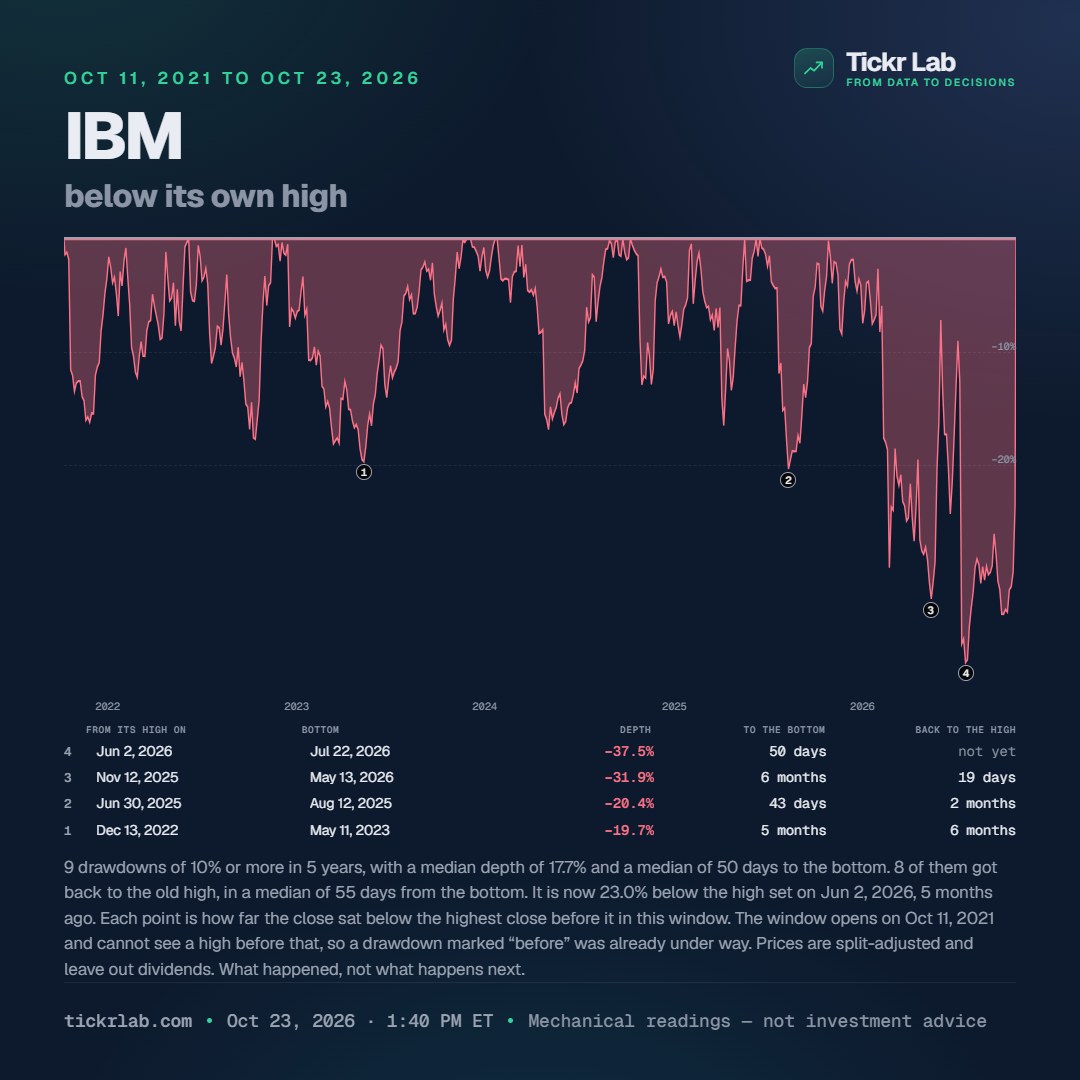
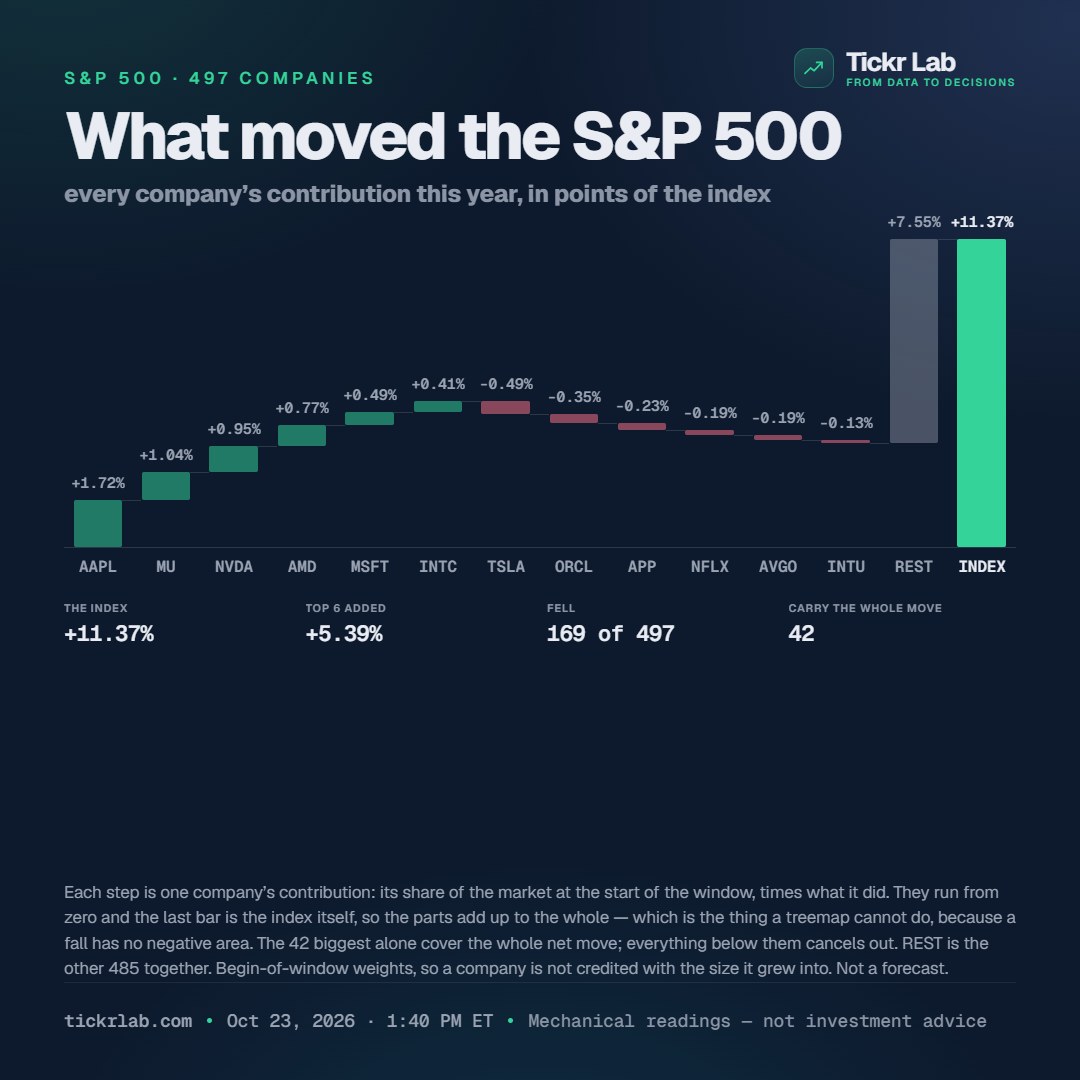
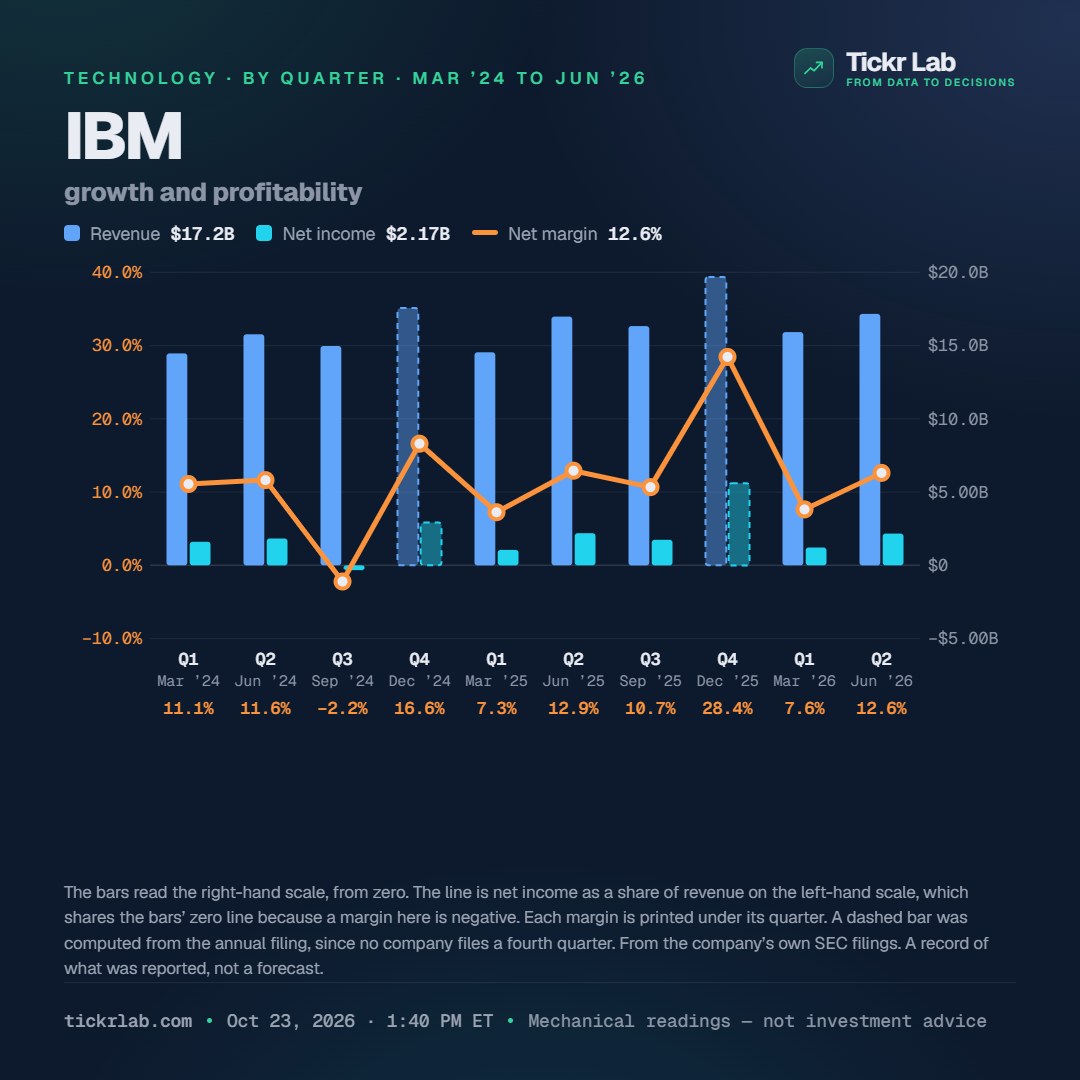
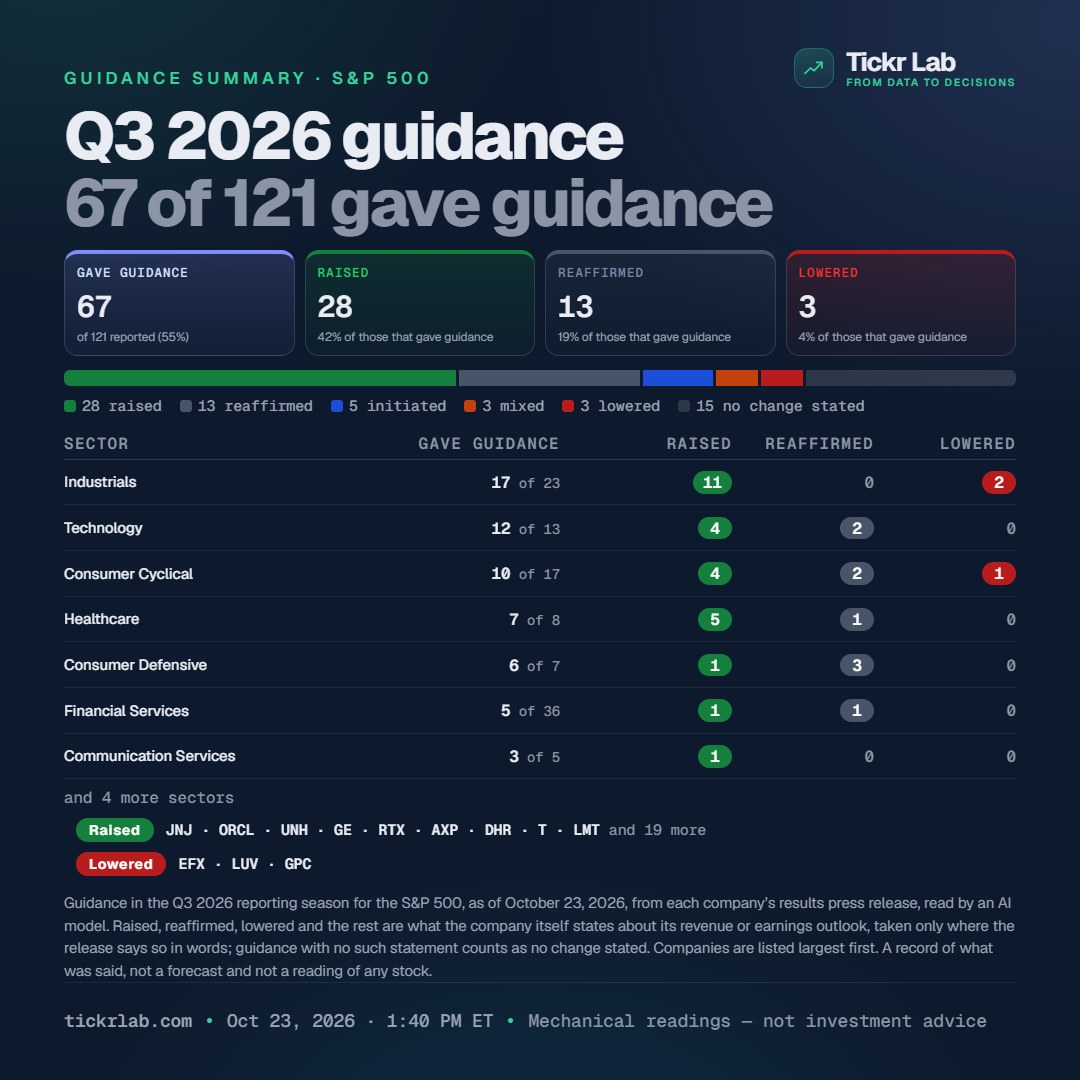
Market snapshots, sector and industry bars, single-stock spotlights, earnings and guidance, the day's filings, article tone. Made from the latest close, every time. Eight of them, as posted:
- Feed, square and story sizes
- Dark, Navy or Light
- Each card dated, with a not-advice line
What the company filed, and who holds it.
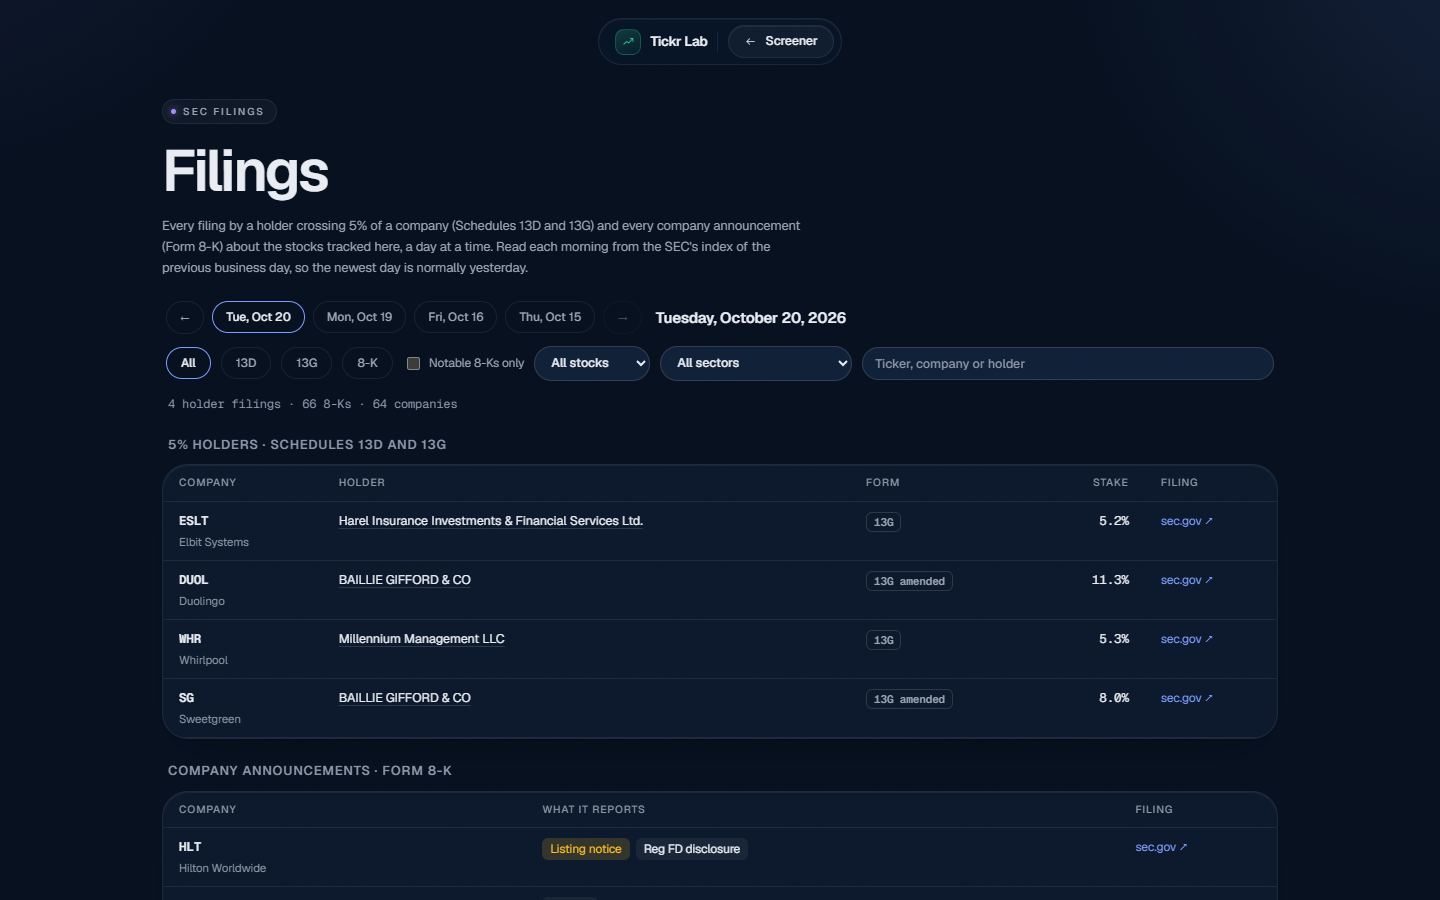
Read from the SEC, every day: 10-Ks and 10-Qs, 8-K announcements, 5% holders, insider trades, institutions' 13Fs and fund holdings.
- Yesterday's filings, a day at a time
- Who added and who cut, quarter on quarter
- Revenue by segment, capital returns, margins
Dark, Navy or Light. Your choice, on every device.
Pick one under Appearance and every page follows: the screener, the stock pages, the pivot and the cards you make.
23 sections on every stock page.
What usually takes a broker, a filings site, a news reader and a spreadsheet, on one page that opens on a summary and goes as deep as you scroll.
The summary
- At a glanceTwelve topics in a sentence each, with the headline number
- AboutWhat the company does
- All fieldsAll 186 fields, grouped, each with its history a click away
- Similar stocksIts closest peers by business and by how they trade
The price
- PriceChart with averages, bands, RSI, volume and the index beside it
- MonthsEvery month's return, year by year
- DrawdownsEvery fall from a high, how deep and how long
- Short interestThe short position over time
- OptionsOpen calls and puts, by expiry
The business
- EarningsEvery report against the estimate, and the next date
- GrowthRevenue, profit and margin by quarter and year
- StatementsIncome, balance sheet and cash flow
- Revenue mixWhere the revenue comes from, by segment
- Capital returnsBuybacks, dividends and the share count
- Against peersThe same measures against its closest rivals
Filings and owners
- SEC EDGARIts filings, read from the source
- EventsEvery 8-K, named by what it reports
- Large holdersAnyone crossing 5%, from 13D and 13G
- InsidersOfficers' and directors' trades, summed up
- Institutions13F managers, who added and who cut
- FundsThe mutual funds and ETFs that hold it
The news
- NewsThe latest headlines, a click from the source
- Article toneEach article read by AI: its tone and a two-sentence summary
The top of Ross Stores' page on October 27, 2026: sixteen topics, with Earnings and Guidance from its results release.
Every article read in full, summed up in two sentences.
An AI model reads each article in a stock's news feed and says what kind of piece it is, how its content leans from −1 to +1, and what it reports, in its own words. You read twenty articles in the time it takes to open two.
- Every S&P 500 company and the semiconductor stocks, through the day
- Only articles mainly about the company count; a passing mention is left out
- The week's average on every stock page, in the screener and on cards
- A description of what was written. It never feeds the Signal
A Zacks columnist labels Nike a bear pick, citing falling earnings estimates, shrinking revenue and a premium valuation. The piece argues the stock's recent stabilization is unlikely to be a sustained recovery.
NKE · Yahoo Finance · Analyst view
JPMorgan raised its view on Intel to a neutral stance from a negative one, citing a solid start by management and AI-related demand, and the shares rose nearly 3%. The article also cites strong Q2 results and better 18A output, but flags tight supply, an expected PC demand drop in 2026 and heavy capital spending that may weigh on cash flow.
INTC · TIKR · Analyst view
The article compares how Chinese memory maker CXMT's push into server DRAM affects Micron and Intel, arguing Micron faces the more direct pricing threat as a pure memory seller. It notes Micron's very strong results, long-term customer agreements and HBM lead as a cushion, while Intel could gain from cheaper memory.
MU · 24/7 Wall St. · Industry
Three readings from October 2026, as stored. Members see the latest on every stock page.
Every results release, read the day it is filed.
When a company files its quarterly results with the SEC, an AI model reads the press release and copies out the figures exactly as printed: at 9:15 am or 6:15 pm Eastern, whichever comes first after the filing (a filing later in the evening is read the next morning). Our own code then checks every one against the release's text. A figure it cannot find there is left blank, never guessed.
- Revenue, operating income, net income and GAAP EPS, each with the change on a year earlier
- The company's own adjusted EPS, under its own name for it
- Guidance in the company's words, with next quarter's revenue against this quarter and full-year EPS against last year
- Whether the company raised, lowered or reaffirmed its outlook, shown only when it says so, with its words quoted
- Checked again against the 10-Q once it is filed
- In the screener, on every stock page and on the public results page. A description of what was reported. It never feeds the Signal
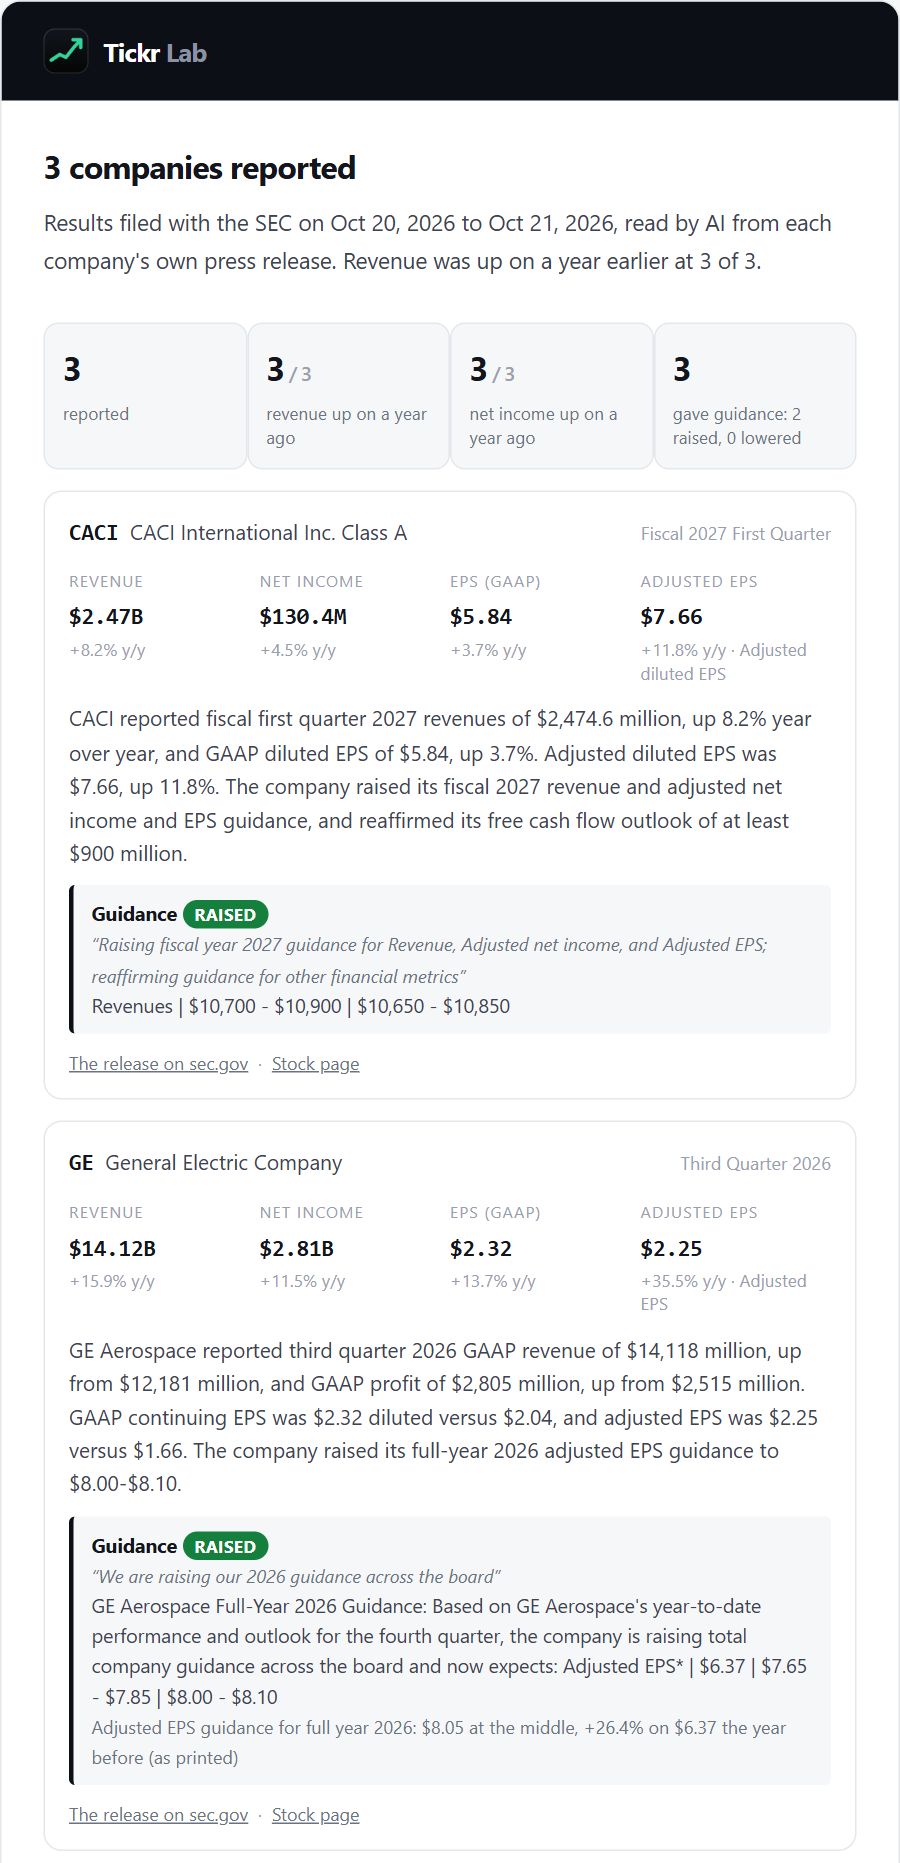
The results email, as it arrives each weekday morning (releases of October 20 and 21, 2026). Free to anyone who asks for it, with a one-click unsubscribe.
The results release comes first. The 10-Q can follow weeks later.
A company publishes its quarter twice: a results press release on the day, and the formal 10-Q report, the same day or up to a few weeks later. We checked when the September quarter appeared on two well-known sites, for 50 companies that reported between October 14 and 28, 2026.
At 9:15 am or 6:15 pm Eastern, whichever comes first after the filing, then checked again against the 10-Q once it is filed.
Showed the quarter before the 10-Q for 15 of the 18 companies still waiting on one.
Showed the quarter before the 10-Q for none of those 18; it appeared about a day after the 10-Q was filed.
Measured on October 29, 2026: 50 results releases filed October 14 to 28, spread across the days; each 10-Q date from the SEC, and the September quarter looked up in each site's financials data that morning. A snapshot of how each site behaved, not a review of either.
33 screens to start from, one click each.
Each one sets the filters, the sort and the columns. Change anything and save it as your own.
Market movers
How it moved
Value and growth
Technical
Earnings
Signal and shorts
Your lists, your columns, your alerts.
Group stocks your way.
Make up to ten lists of your own, beside the 28 themes built in: a watchlist, an idea, a sector you follow.
- A tab of its own on the screener
- Works in screens, the pivot and the cards
Show only the columns you read.
Start from a ready-made view or build your own from any of the 167 columns, and switch between them in one click.
- Up to ten saved views
- Dark, Navy or Light, and the layout you left, on every device
Hear when something changes.
Up to five alerts, each watching one stock, shown the next time you open the site.
- Price rises above or falls below a level
- Crosses its 50- or 200-day average
- Signal is upgraded or downgraded
- RSI crosses a level
- Sets a new 52-week high or low
- Moves more than a set % in a day
Everything a stock page needs, refreshed on a schedule.
Prices twice a day and every half hour while the market is open; filings each morning; news through the day.
Prices
Daily closes back to 1998, refreshed during market hours.
Fundamentals
Valuation, margins, growth, balance sheet, earnings.
Company filings
10-K and 10-Q figures, segments, capital returns.
8-K announcements
Every material event, named by its item.
5% holders
Schedules 13D and 13G, the next morning.
Institutions
13F managers, who added and who cut.
Funds
Which mutual funds and ETFs hold each stock.
Insider trades
Open-market buys and sales, from Form 4s.
Short interest
Twice-monthly positions, with history.
Options
Open calls and puts by expiry.
News and tone
Headlines, and an AI reading of each article's tone.
Index membership
S&P 500 and Nasdaq 100.
A reading of where a stock stands. Not a tip.
Every stock gets one of six words after each close, from a fixed set of rules, and the rule that fired is shown beside it. The words describe strength. They are not instructions to trade, and nothing here ranks winners or sets price targets.
We have tested whether these readings predict returns eleven different ways. Ten came back flat. Every test is written up, including the ones that failed.
The full research register opens with the paid Research plan.
Free while we are in beta.
- The full screener: 167 columns, 33 ready-made screens
- Every stock page, all 23 sections
- Article tone, summarized by AI
- Your own themes and column views
- Pivot view with 28 measures
- Visuals: cards in three sizes and three themes
- Alerts and paper positions
- Research: every backtest written up, the indicator lab and the strategy studies
- Backtesting: test your own screens and rules on past data
- AI: ask questions about the screen and get company summaries
No prices yet. Members will hear before anything changes.
The ones people ask.
What does "beta" mean here?
The product works and is used every day, but it is still changing. Some things will move or be renamed, and there may be rough edges.
Is it really free?
Yes, during the beta. Research, backtesting and AI will come later as paid options, and what each plan includes will be said clearly before anything is charged.
Can I look before signing up?
Yes. The guest preview opens the whole table on twenty stocks, every column and every Signal, with no account. Joining the beta opens all of them; ask for an invite code on the sign-up form if one is needed.
Is this investment advice?
No. Every reading describes where a stock stands, with the rule that produced it. It knows nothing about you, it is not a recommendation, and nothing on the site ranks winners or sets targets.
Which stocks are covered?
US-listed stocks and a few index funds, 1,282 today, including every S&P 500 company. The list is chosen by hand and includes companies that have fallen a long way, so the screen is not only today's leaders.
Where does the data come from?
Prices from Twelve Data. Company figures from each company's results release while it is the newest, then its 10-Q or 10-K, with Twelve Data where neither gives one; market value, forward estimates and short interest from Twelve Data. Company filings, insider trades, 8-Ks, large-holder filings, 13Fs and fund holdings from the SEC; short interest from FINRA; options from the OCC; exchange rates from the European Central Bank; headlines from public news feeds. The Signals and every derived figure are worked out here from those inputs.
Can I use the cards in my own posts?
Yes. That is what they are for. Each card carries the Tickr Lab mark, its date and a not-advice line.
Look at the real thing.
The guest preview opens twenty stocks with no sign-up. The beta opens all of them, free.
Get new posts by email
An email when something new goes up — a few a month at most. Nothing else, and no sharing your address with anyone.
You will get one email asking you to confirm. Every message after that has a one-click unsubscribe, and it works without signing in. For the other mailings, such as Earnings results each weekday morning, see your email preferences.