After the midterms: 19 rises in 19, and what that record does not say
The S&P 500 has been higher a year after every midterm election since 1950. We checked the record: how strong it is, how much rests on the start date and the window, the falls along the way, and why it says little about the next month or two.
Americans vote in the midterm elections on Tuesday, November 3. A chart going round this week says the S&P 500 has risen in the twelve months after every midterm since 1950: nineteen out of nineteen. We checked it against the index's own history, and it holds. This post sets out how strong that record is, how much depends on the way it is measured, and what it does not say.
19 out of 19, measured from election day
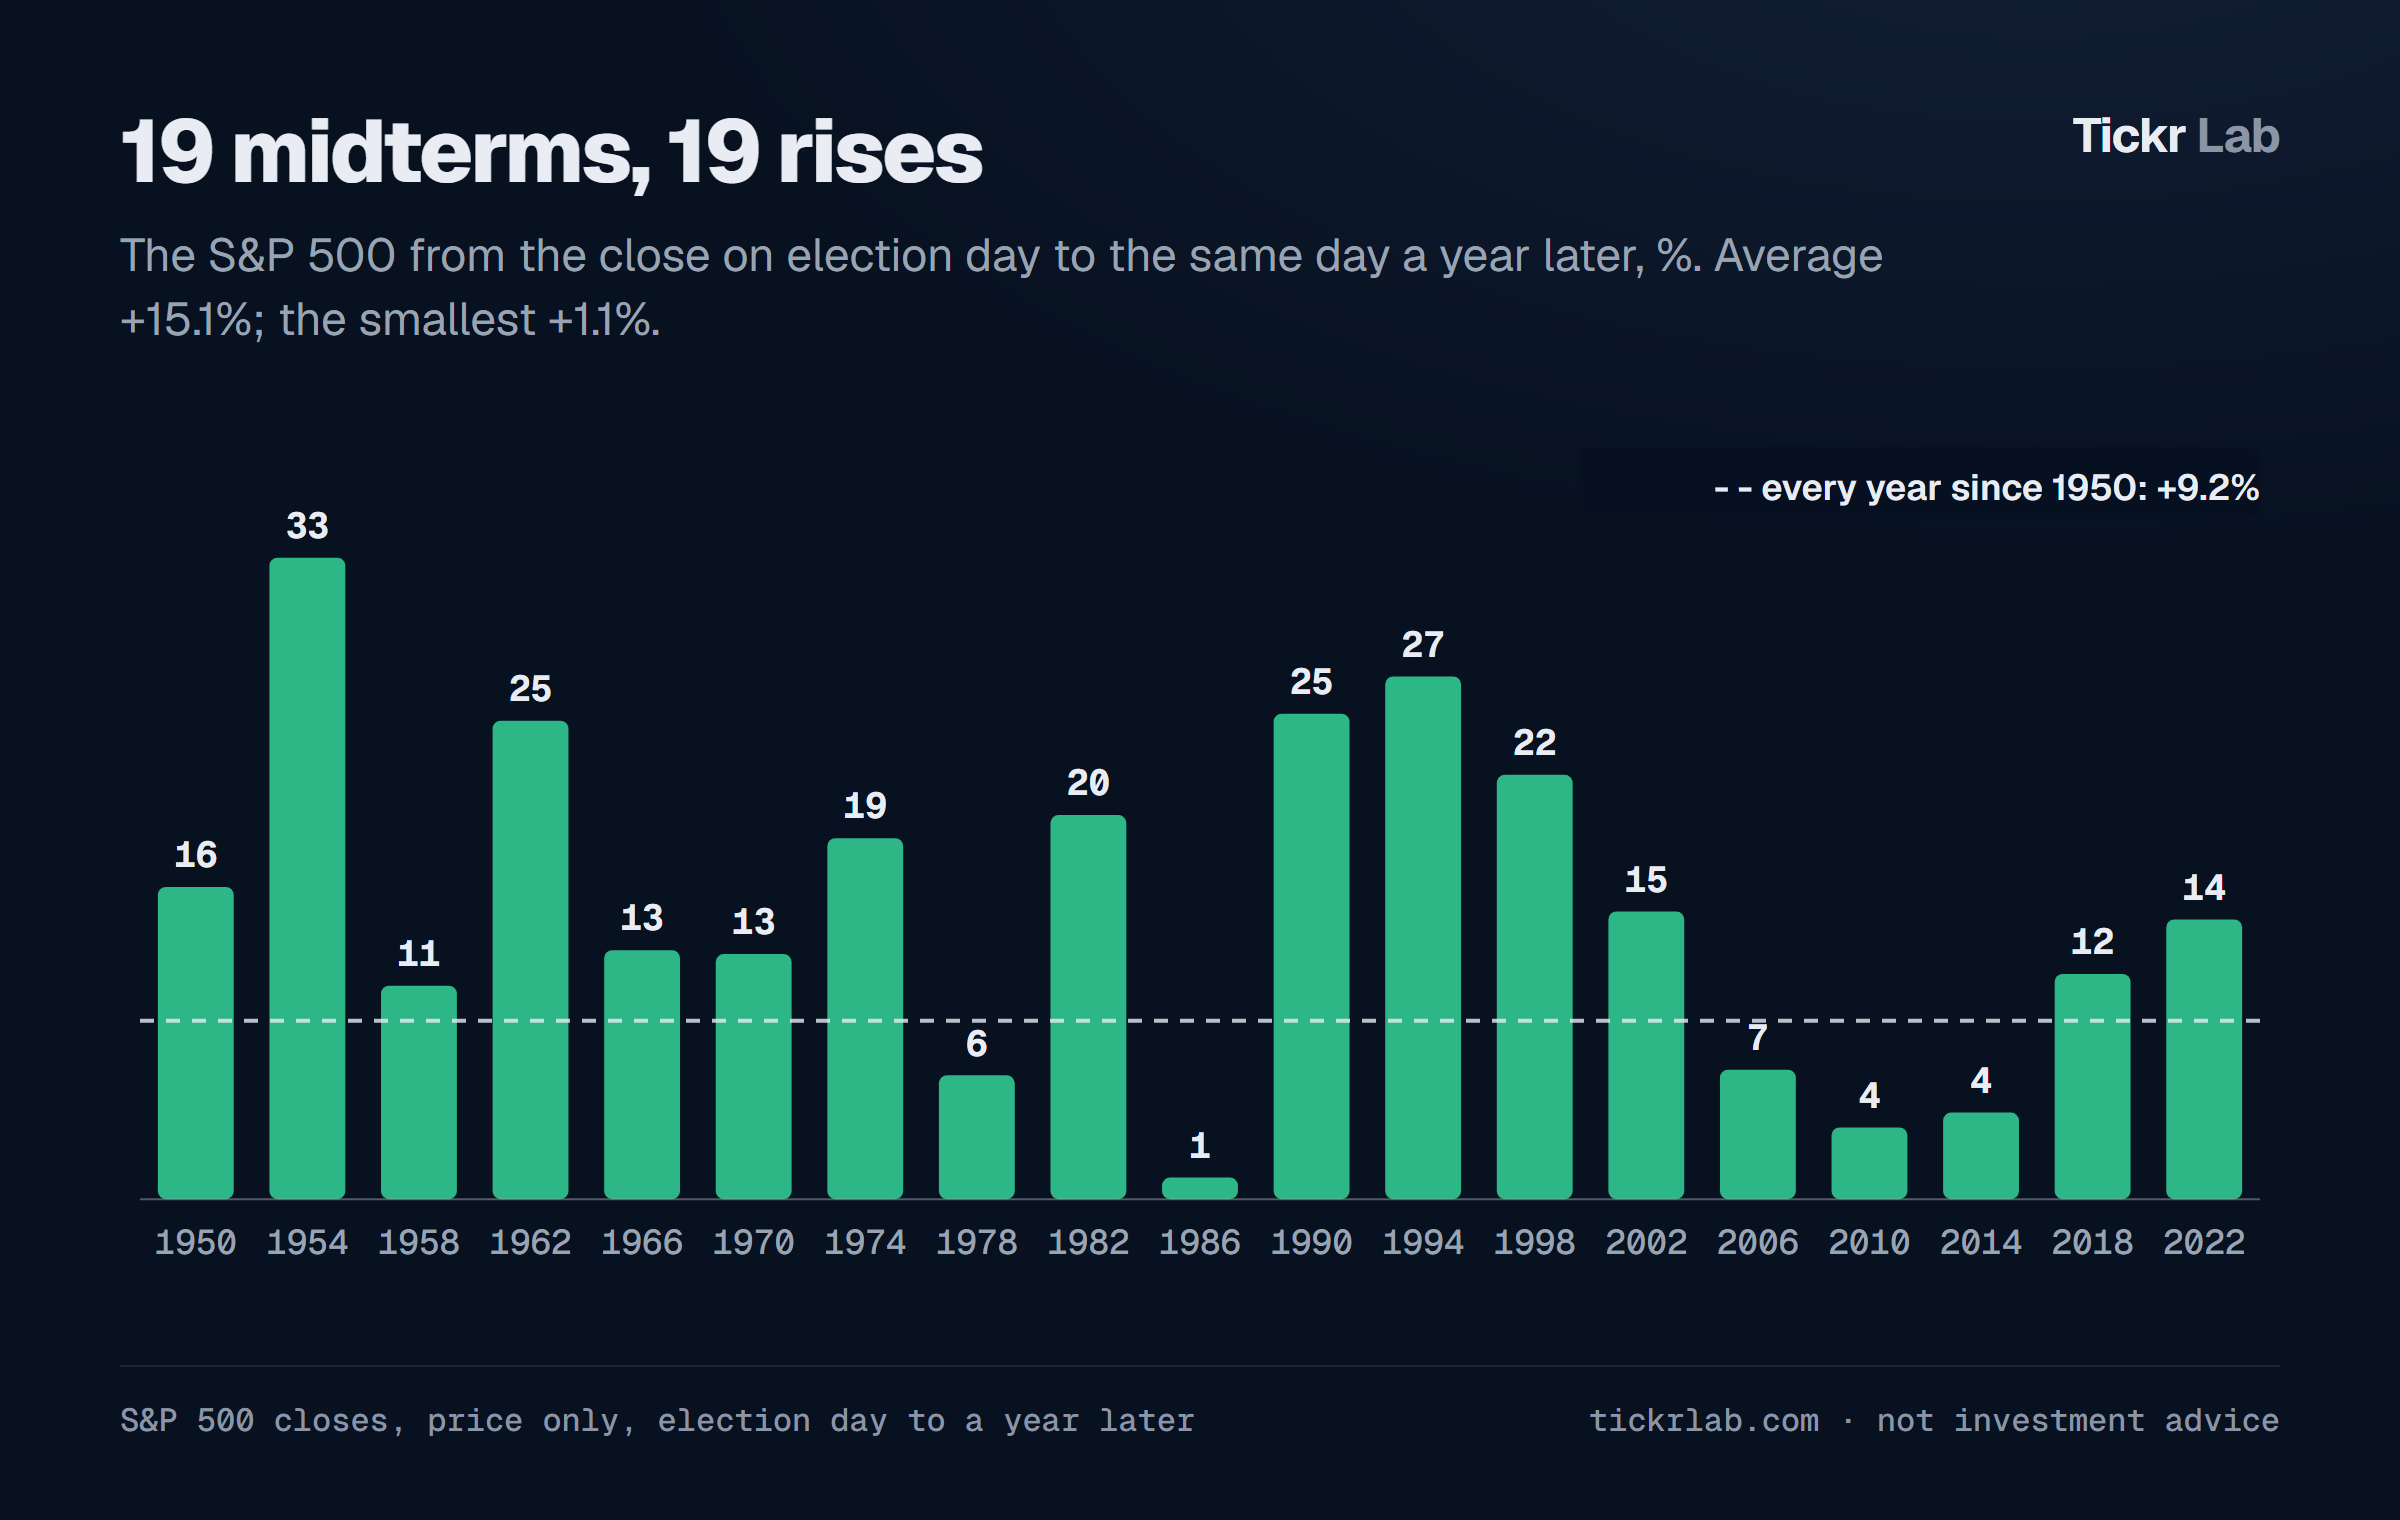
Measured from the close on election day to the same date a year later, the S&P 500 rose after all 19 midterms from 1950 to 2022. The average was +15.1%. The twelve months from every November election day since 1950, midterm or not, averaged +9.2%. The smallest rise was +1.1%, after 1986. The Nasdaq Composite, which starts in 1971, rose after 12 of the 13 midterms it covers, by +25.3% on average; the exception was also the year after 1986, when it fell 11.6%.
Our figures differ year by year from the chart going round, which does not say how it measured: we have the year after 2022 at +14.5% where it shows +8.3%. The count of nineteen is the same.
The best year of the four
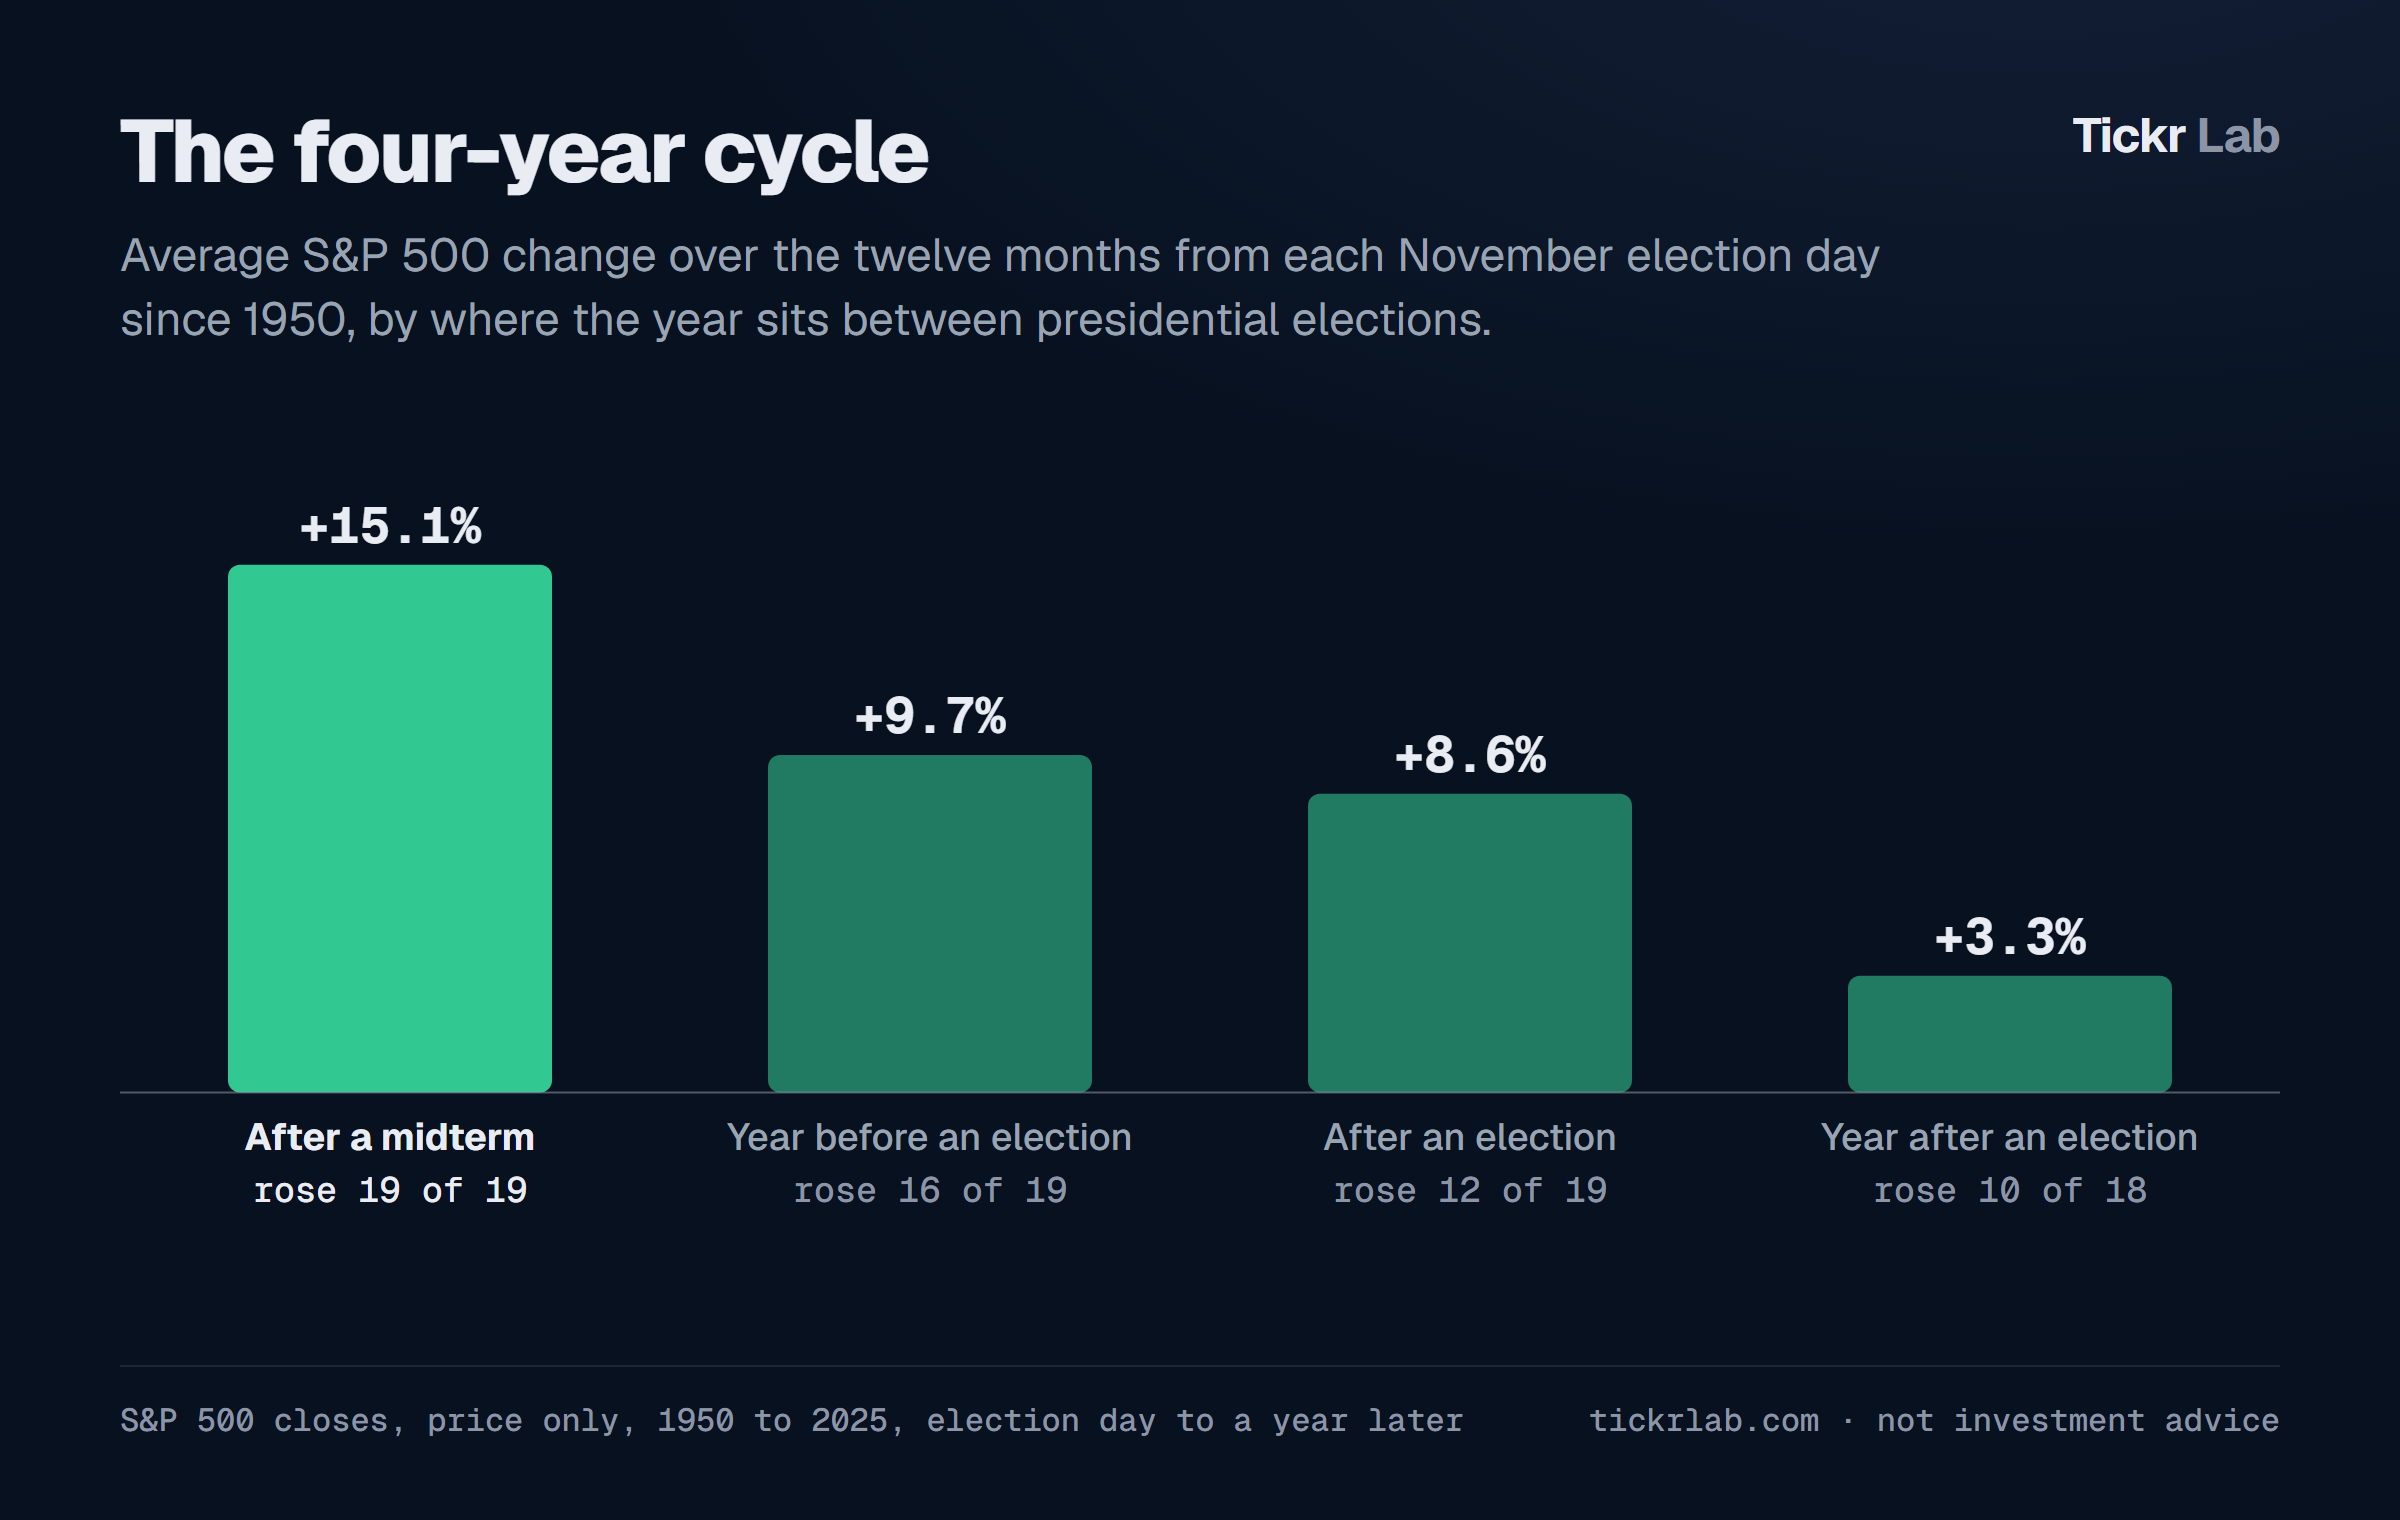
The midterm year is one stop in the four-year presidential cycle, which has been written about for more than fifty years. Grouping every November-to-November year since 1950 by where it sits:
- After a midterm: +15.1% on average, 19 of 19 higher.
- The year before a presidential election: +9.7%, 16 of 19 higher.
- After a presidential election: +8.6%, 12 of 19 higher.
- The year after a presidential election, into the midterm: +3.3%, 10 of 18 higher.
The usual explanations are that a new administration does its least popular work early and pushes for growth before it faces voters again, and that the uncertainty over who controls Congress lifts once the votes are counted. Those are explanations people offer; the numbers show the pattern, not the reason.
How solid is nineteen out of nineteen?
Stronger than most calendar patterns, and weaker than the headline sounds.
- It is unlikely to be pure chance. Years from other election days ended higher 68% of the time. At that rate, nineteen in a row would come up about once in 1,600 tries, and the gap in averages (15.1% against 7.3% for the other years) is about two and a half times its likely error.
- But the start date helps. The index goes back further than 1950. After the 1938 midterm it fell 5.1%; after 1946 it was flat, +0.1%; after 1942 it rose 24.3%. Since 1938 the count is 20 of 22.
- So does the window. Measured over the calendar year after each midterm instead, it is 17 of 19: 2011 ended flat and 2015 down 0.7%.
- Nineteen is a small number. Many calendar patterns get tested, and the ones with a clean record are the ones that get passed around.
One point in its favour: the pattern was well known by the 1970s and kept working afterwards. All 14 midterms since 1970 were followed by a higher index a year later.
Higher by the end, not all the way there
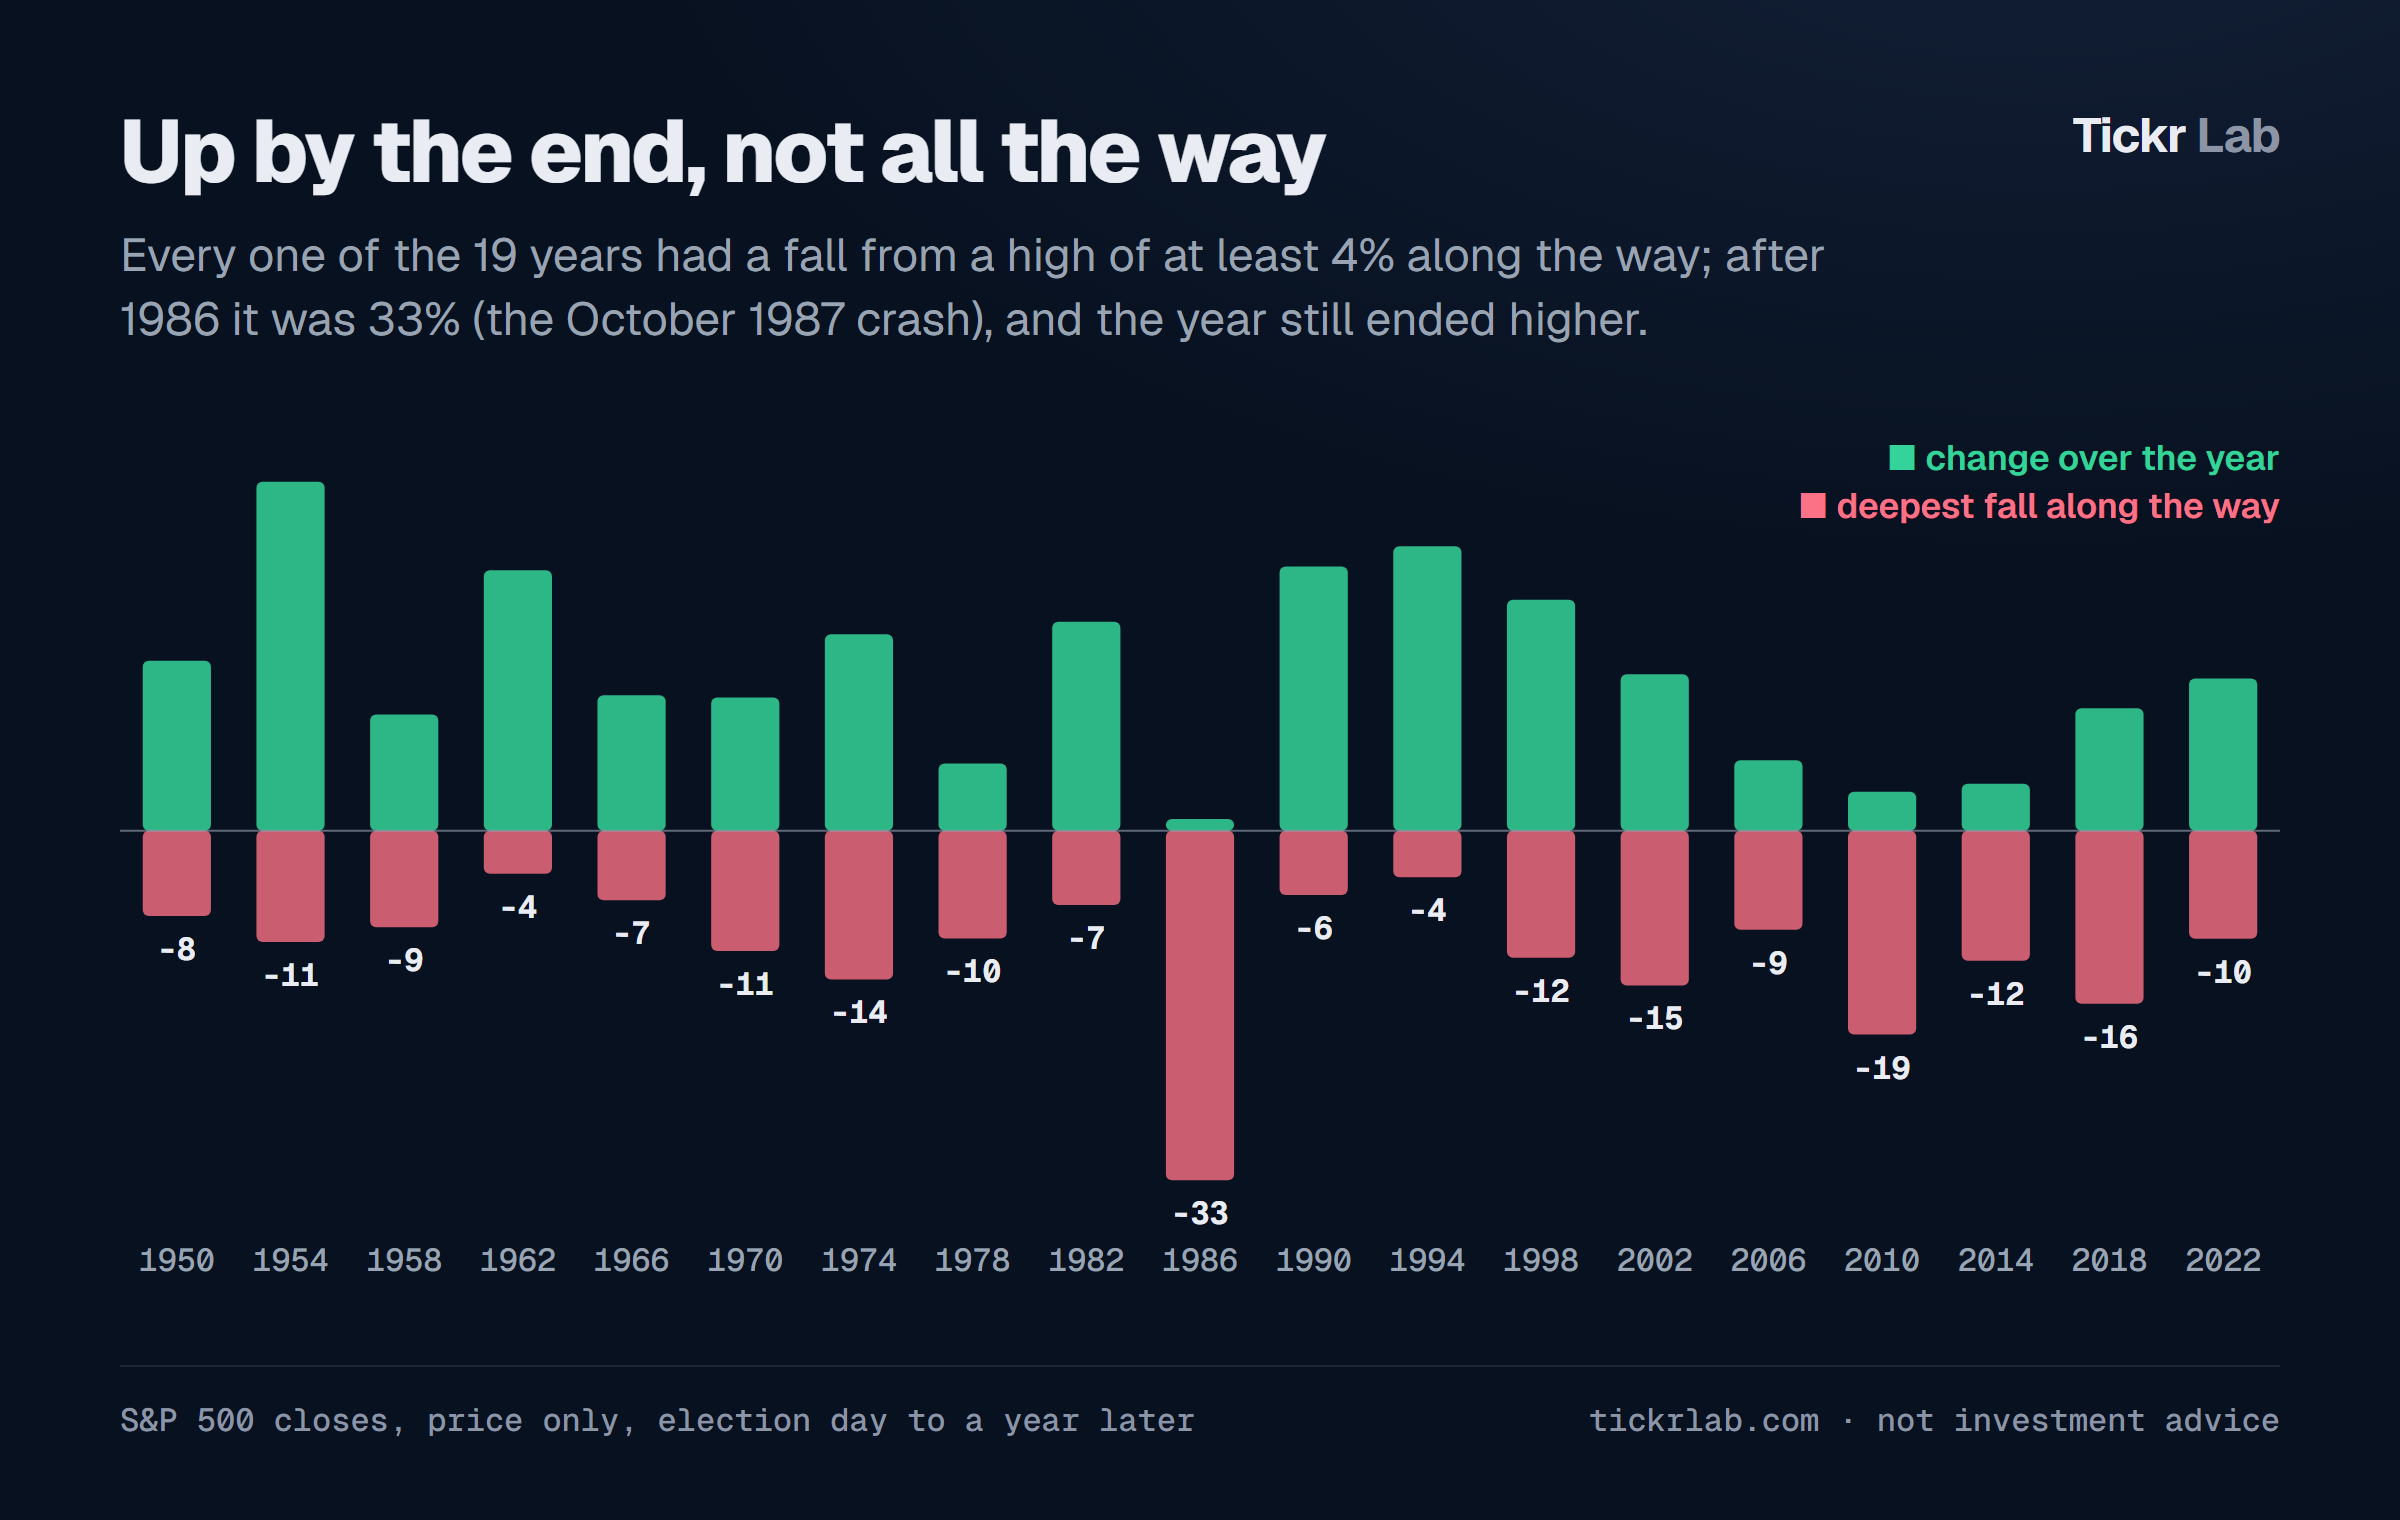
A rise over the year is not a smooth ride. Every one of the nineteen years had a fall of at least 4% from a high along the way, and most had one of 9% or more. The year after 1986 contained the crash of Monday, October 19, 1987: the index fell 33% from its August high, and still ended the twelve months 1.1% up. After 2010 the fall was 19%, after 2018 16%.
Over a month or two, nothing unusual
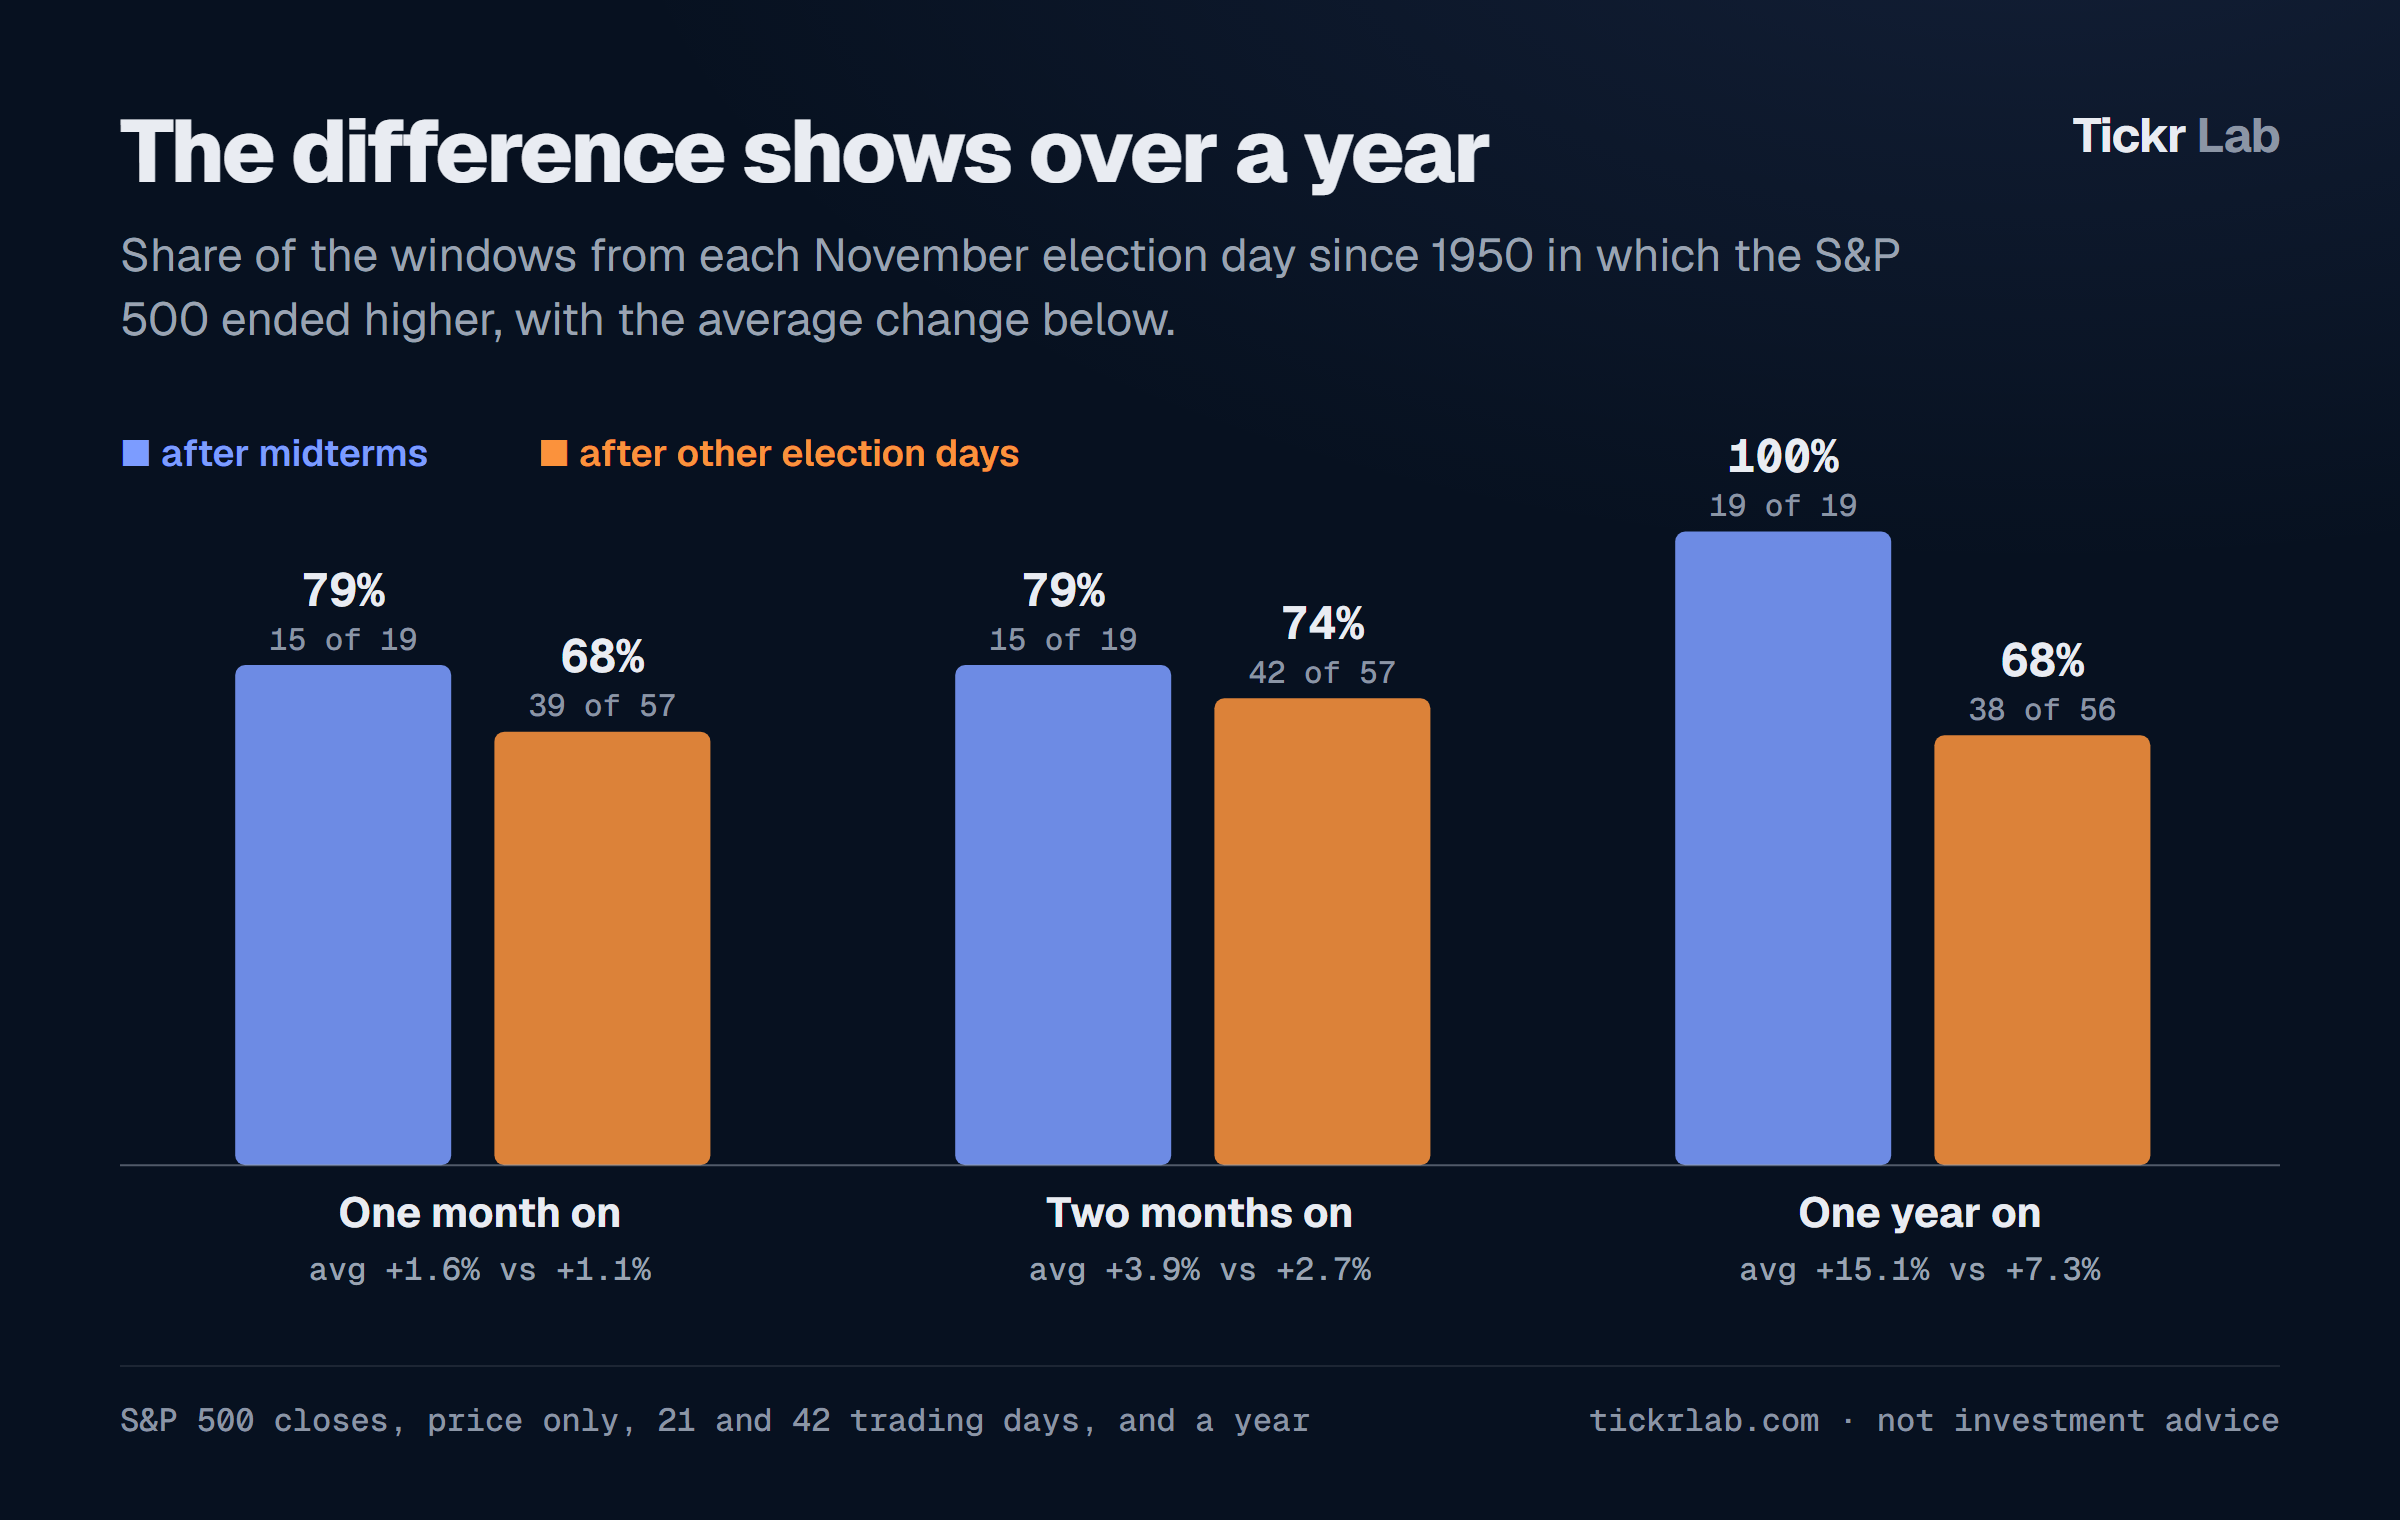
The record belongs to the full year. Over the first month after a midterm election day the index rose 15 times in 19, by +1.6% on average, against +1.1% after other election days. Over two months it was +3.9% against +2.7%. With nineteen years, differences that size are what chance alone produces.
Where 2026 starts
This year the S&P 500 goes into the vote 10.7% higher than it began the year, at Friday's close of 7,580, and the Nasdaq 9.4% higher. In ten of the nineteen midterm years the index was already up by election day; the twelve months that followed rose in all ten, by 13.0% on average, against 17.5% in the nine years that started from a fall. Ten and nine years are too few to make much of the gap.
None of this says what the index will do after Tuesday. It is what it did after nineteen midterms, measured the same way each time, and the 20th will be its own year.
S&P 500 and Nasdaq Composite daily closes from Yahoo Finance, price only, without dividends. Before March 1957 the S&P index covered 90 companies rather than 500. Each window runs from the close on election day (the first Tuesday after the first Monday in November) to the close on the same date a year later, or the last trading day before it. "Other years" are the twelve months from the election days of the other three years of each cycle, from 1951 (to 2024 for the full year, whose last window ends this week). Deepest fall is the largest drop from a closing high within each window.