Health care, sector by the numbers
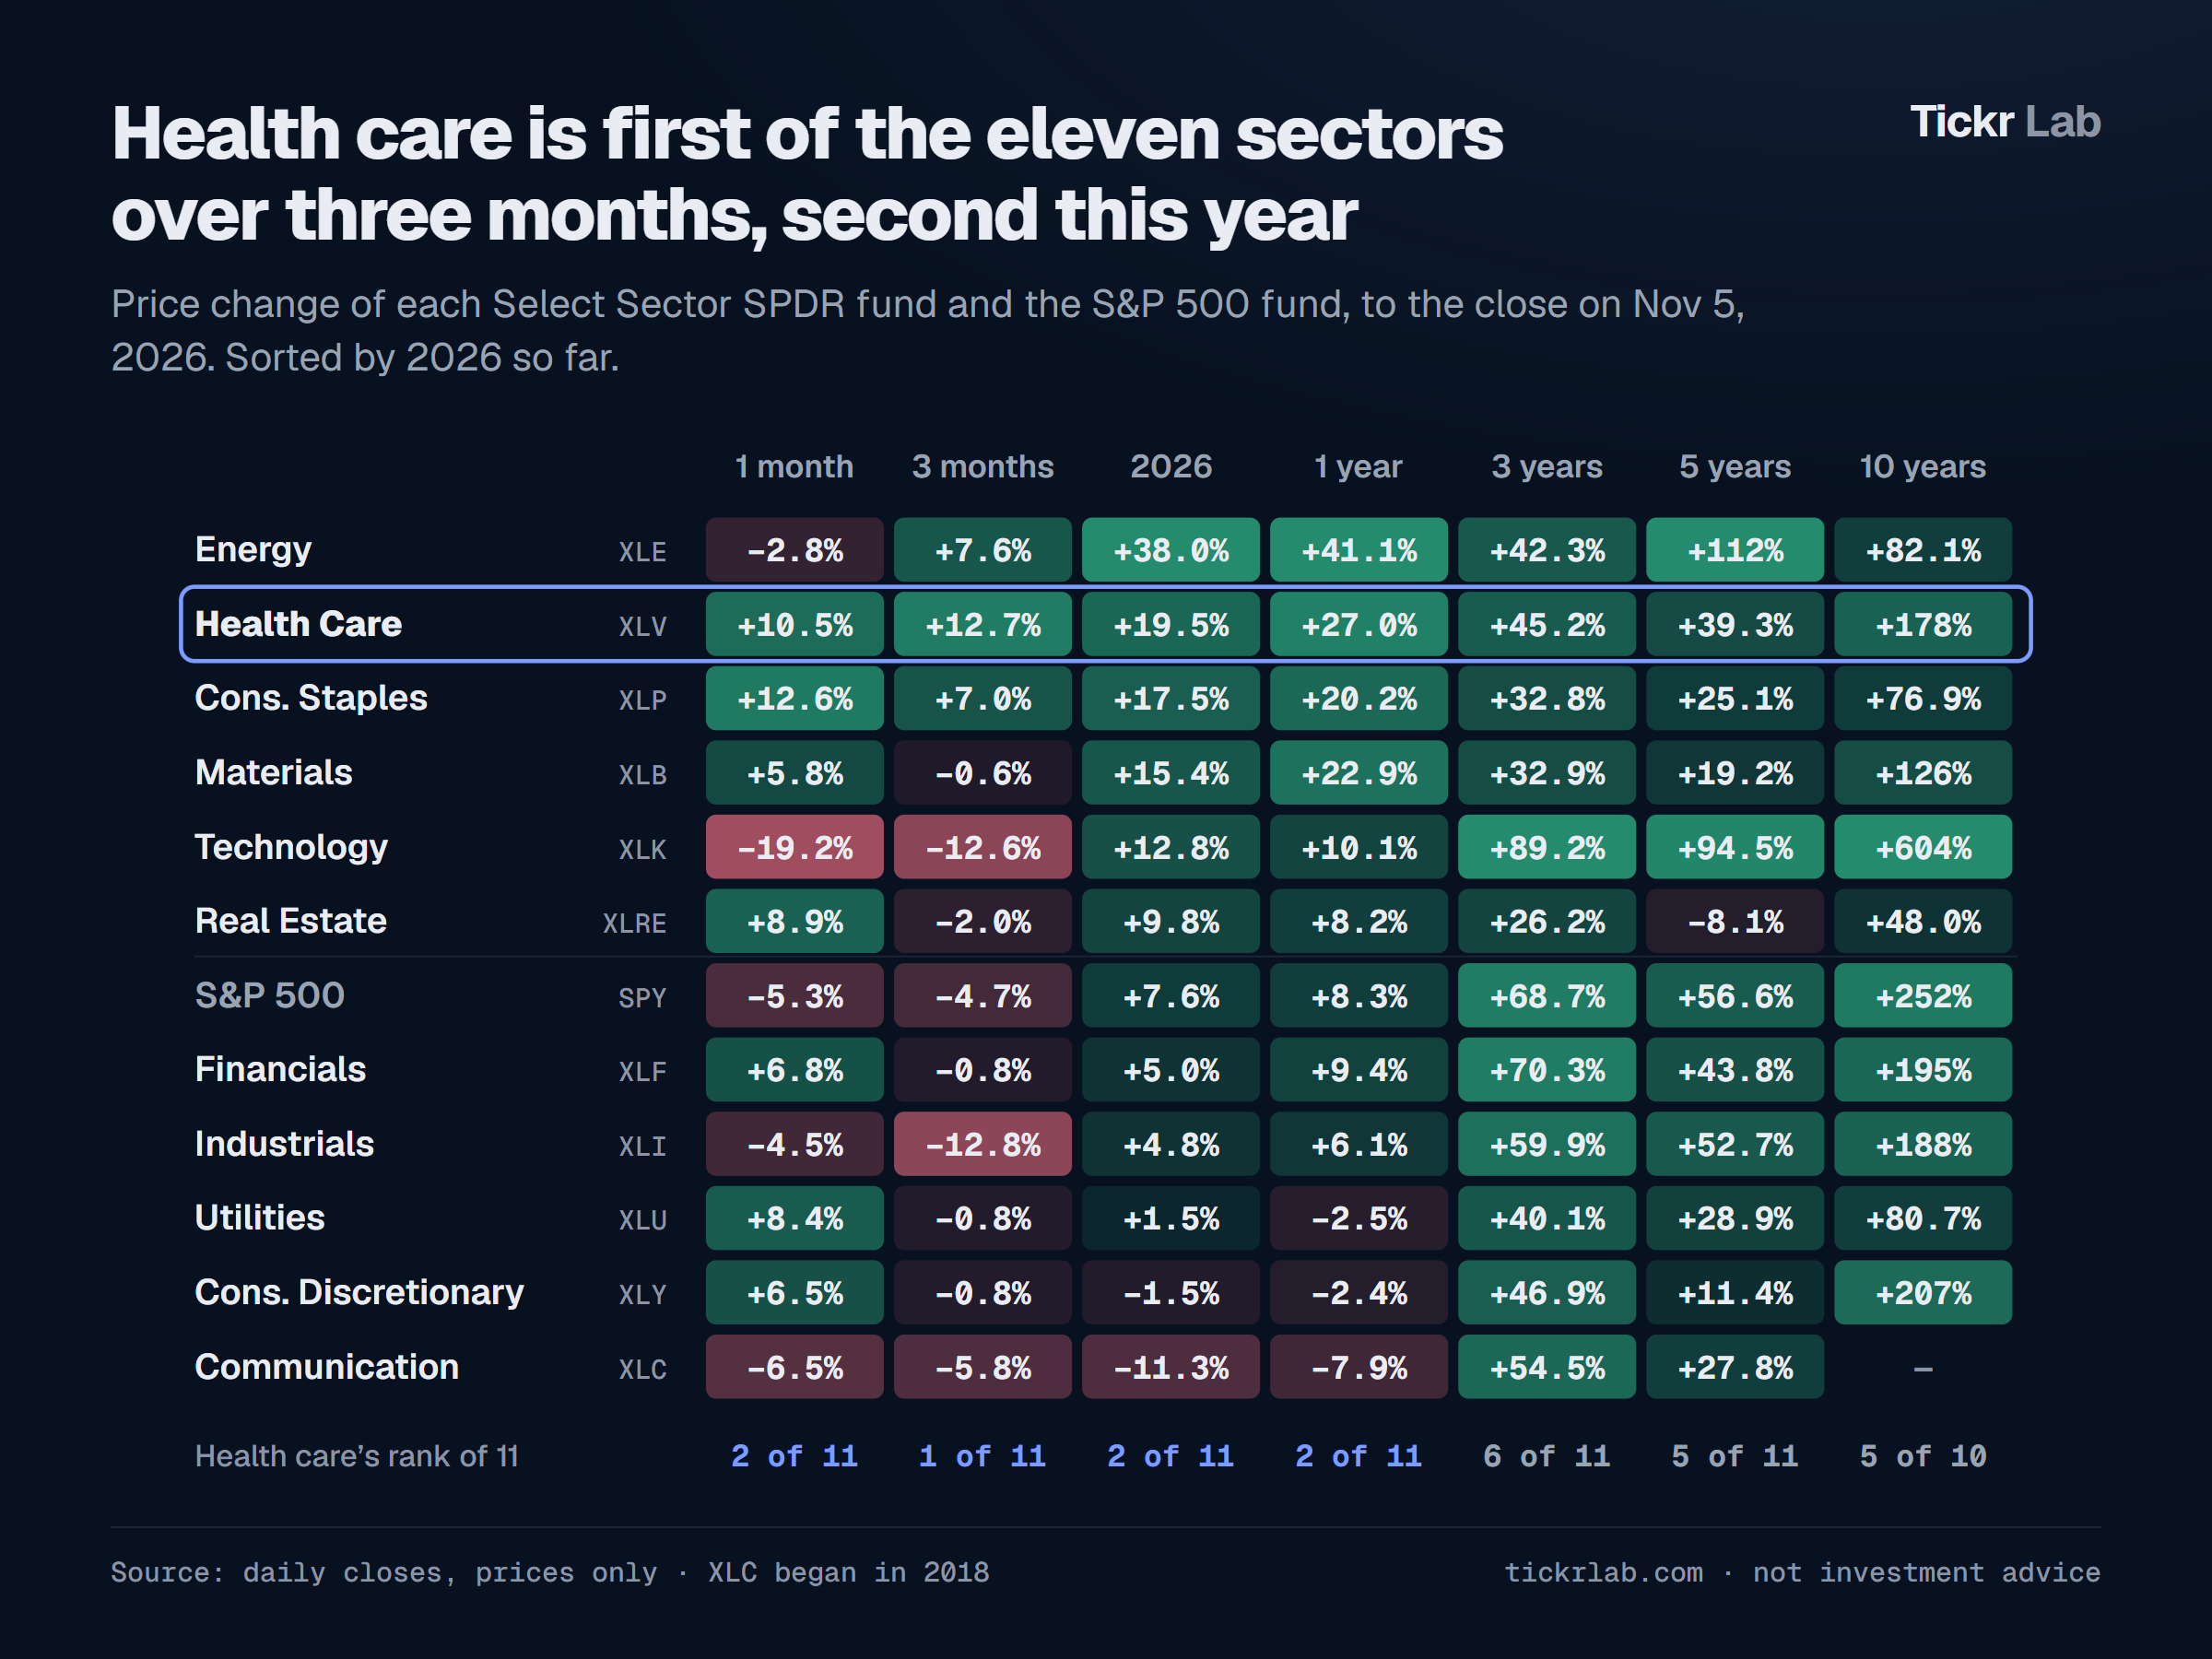
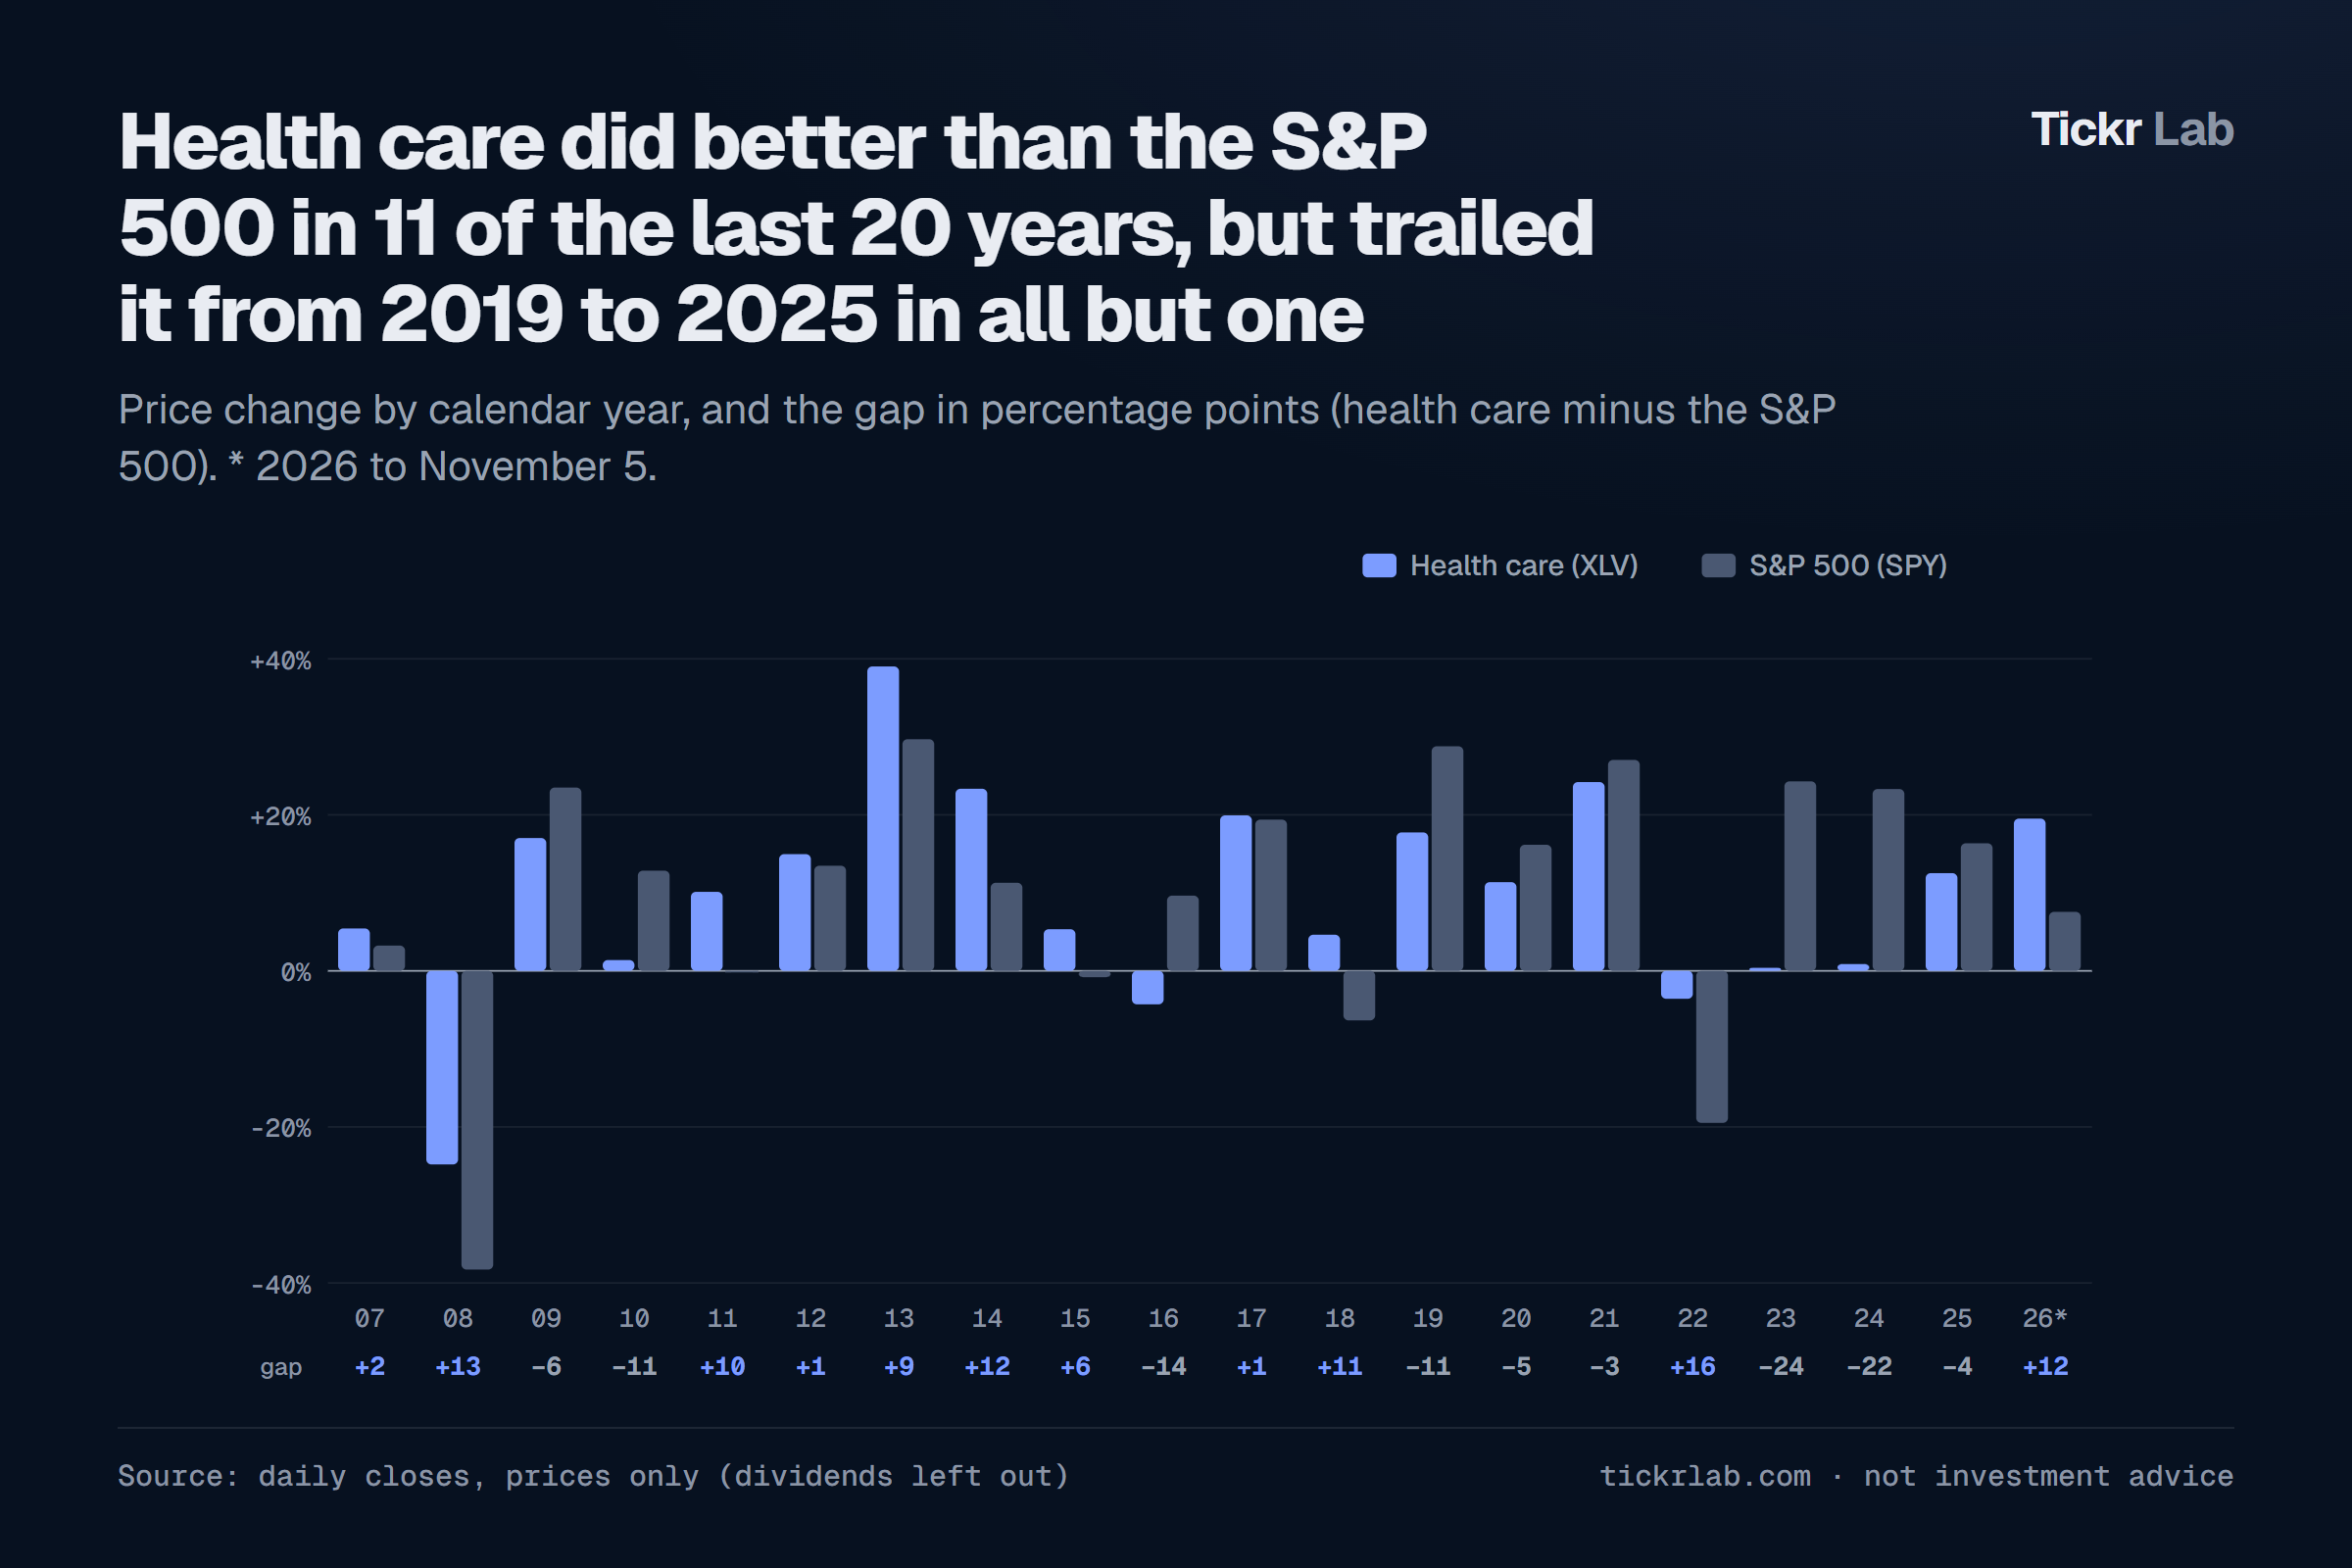
Health care is +19.5% this year against +7.6% for the S&P 500, after its weakest point against the index in twenty years in May. Price, earnings, valuation against the other sectors, and the fifteen largest companies.
Health care has turned from the S&P 500’s laggard into one of its leaders in six months. The numbers, with as little writing as we could manage, to the close on Thursday, November 5, 2026.
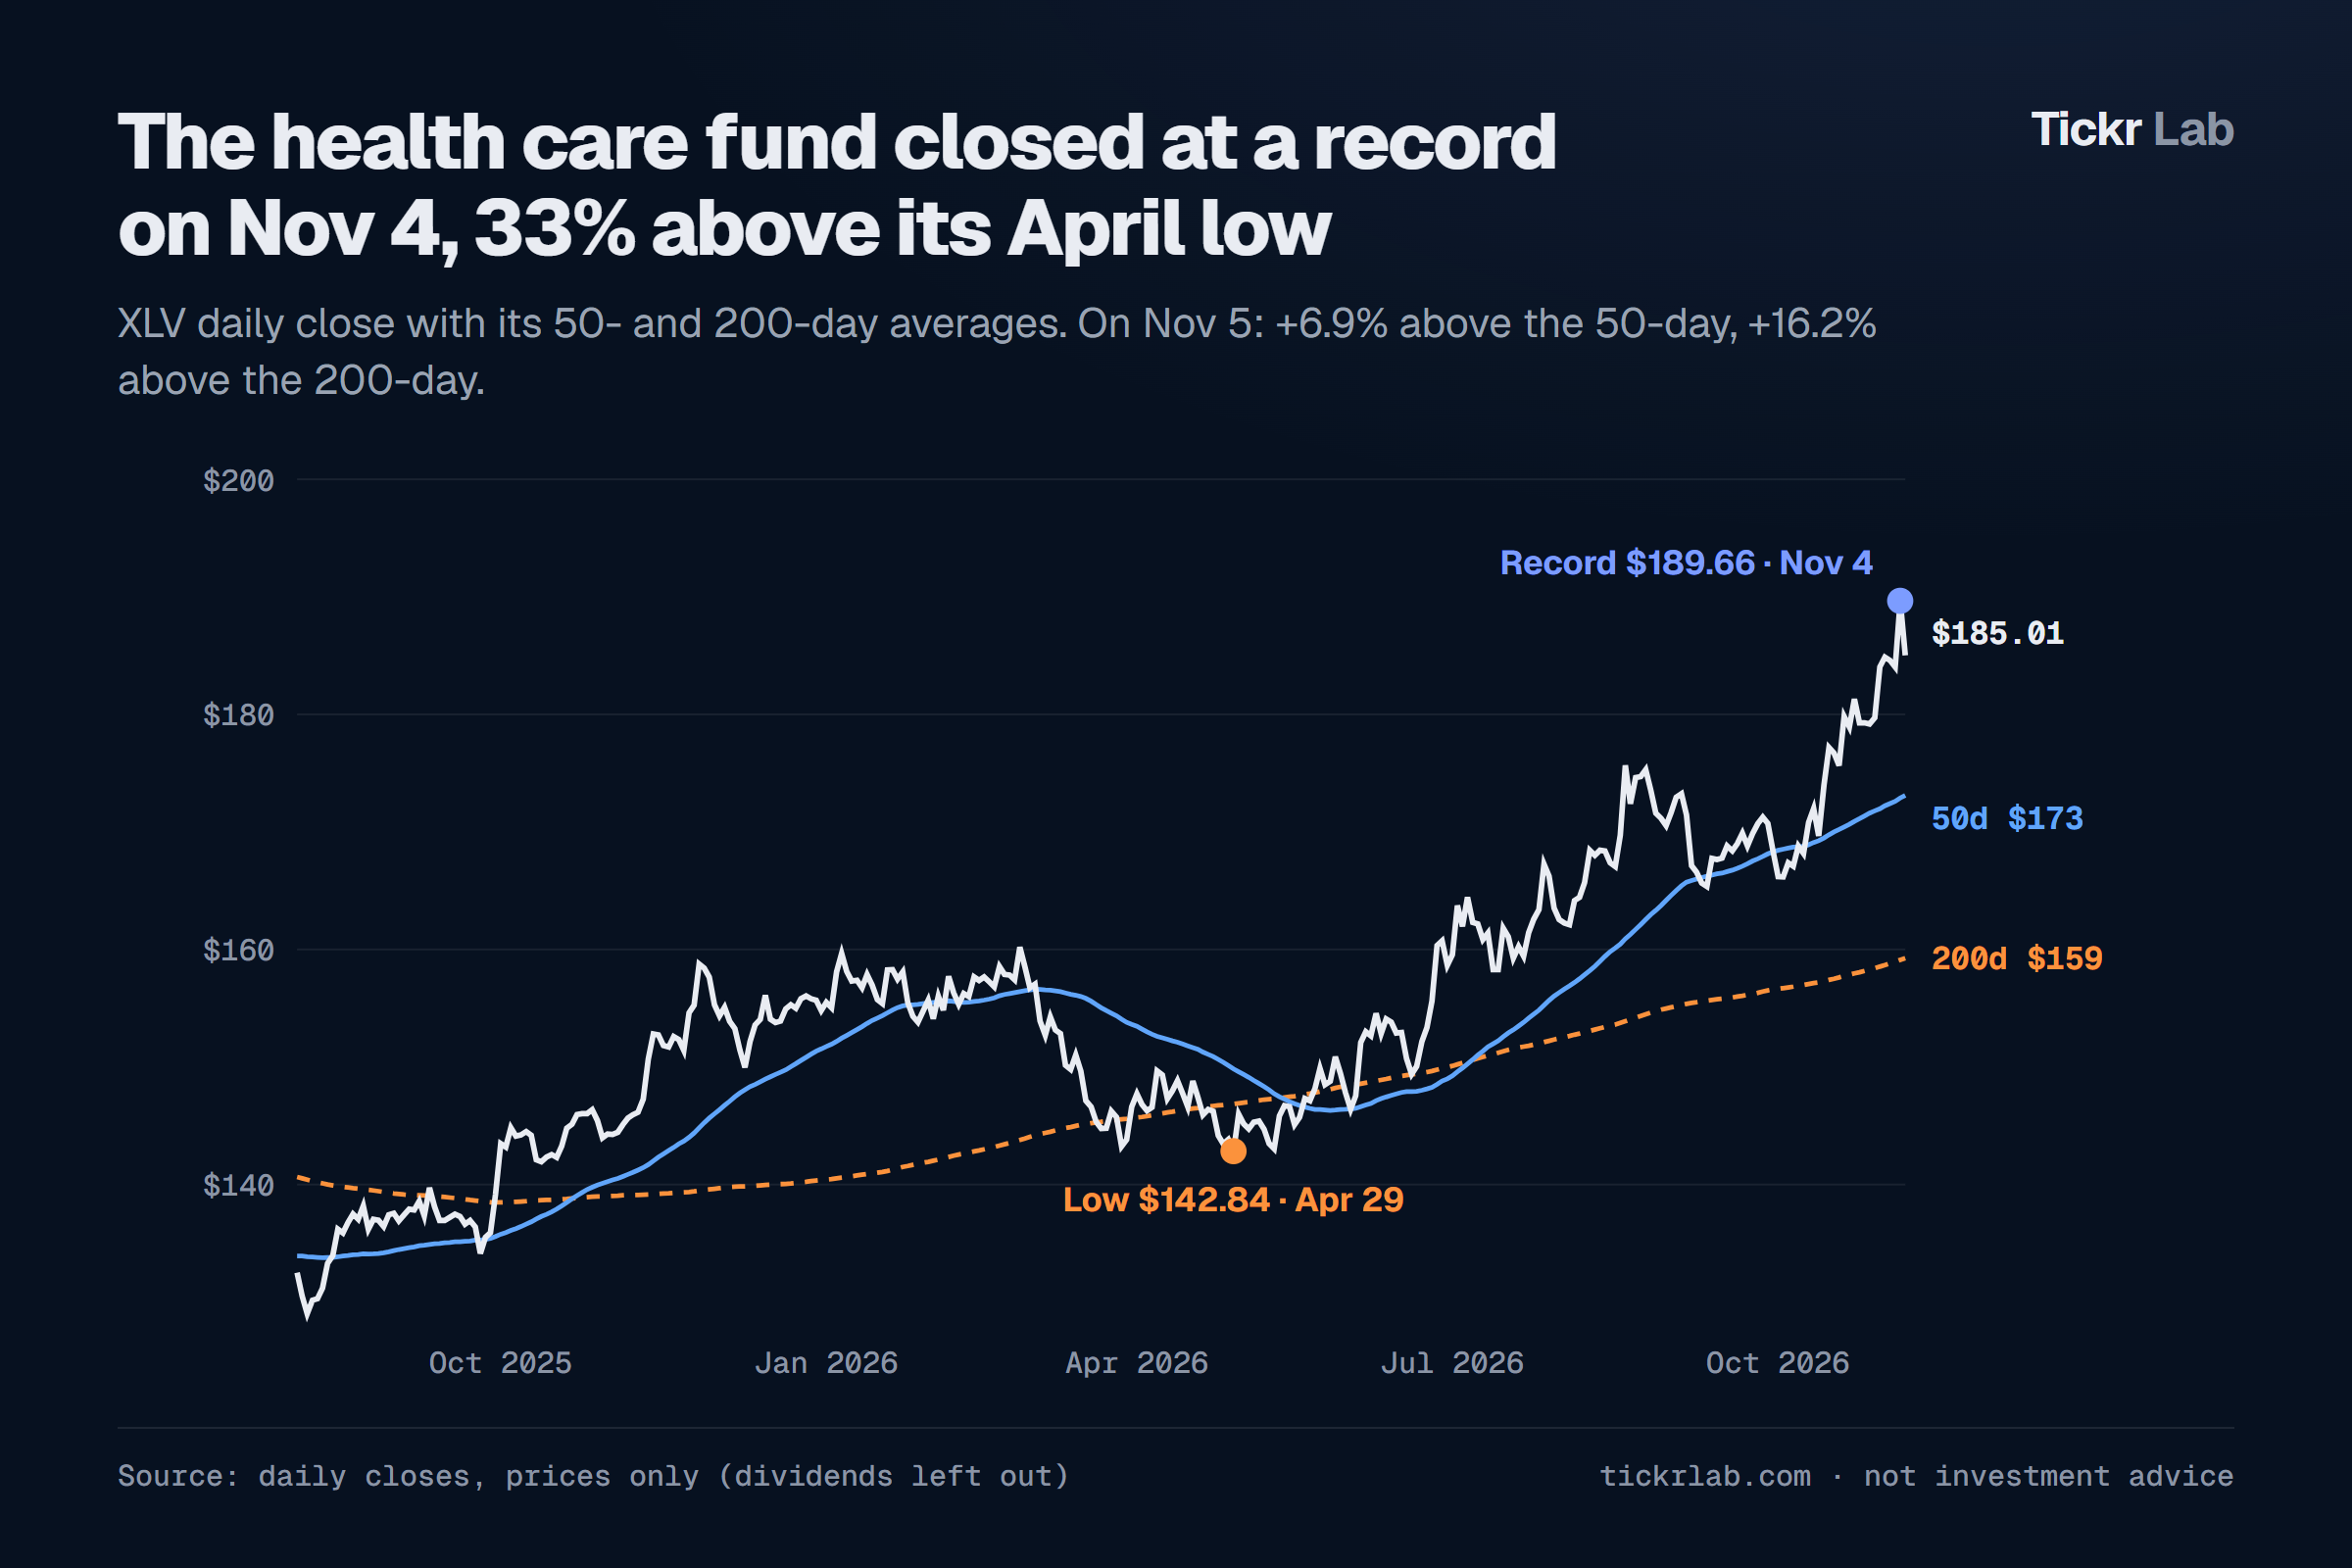
- Price: the health care fund XLV is +19.5% this year against +7.6% for the S&P 500 fund, and +12.7% over three months against −4.7%. It closed at a record $189.66 on Wednesday, November 4.
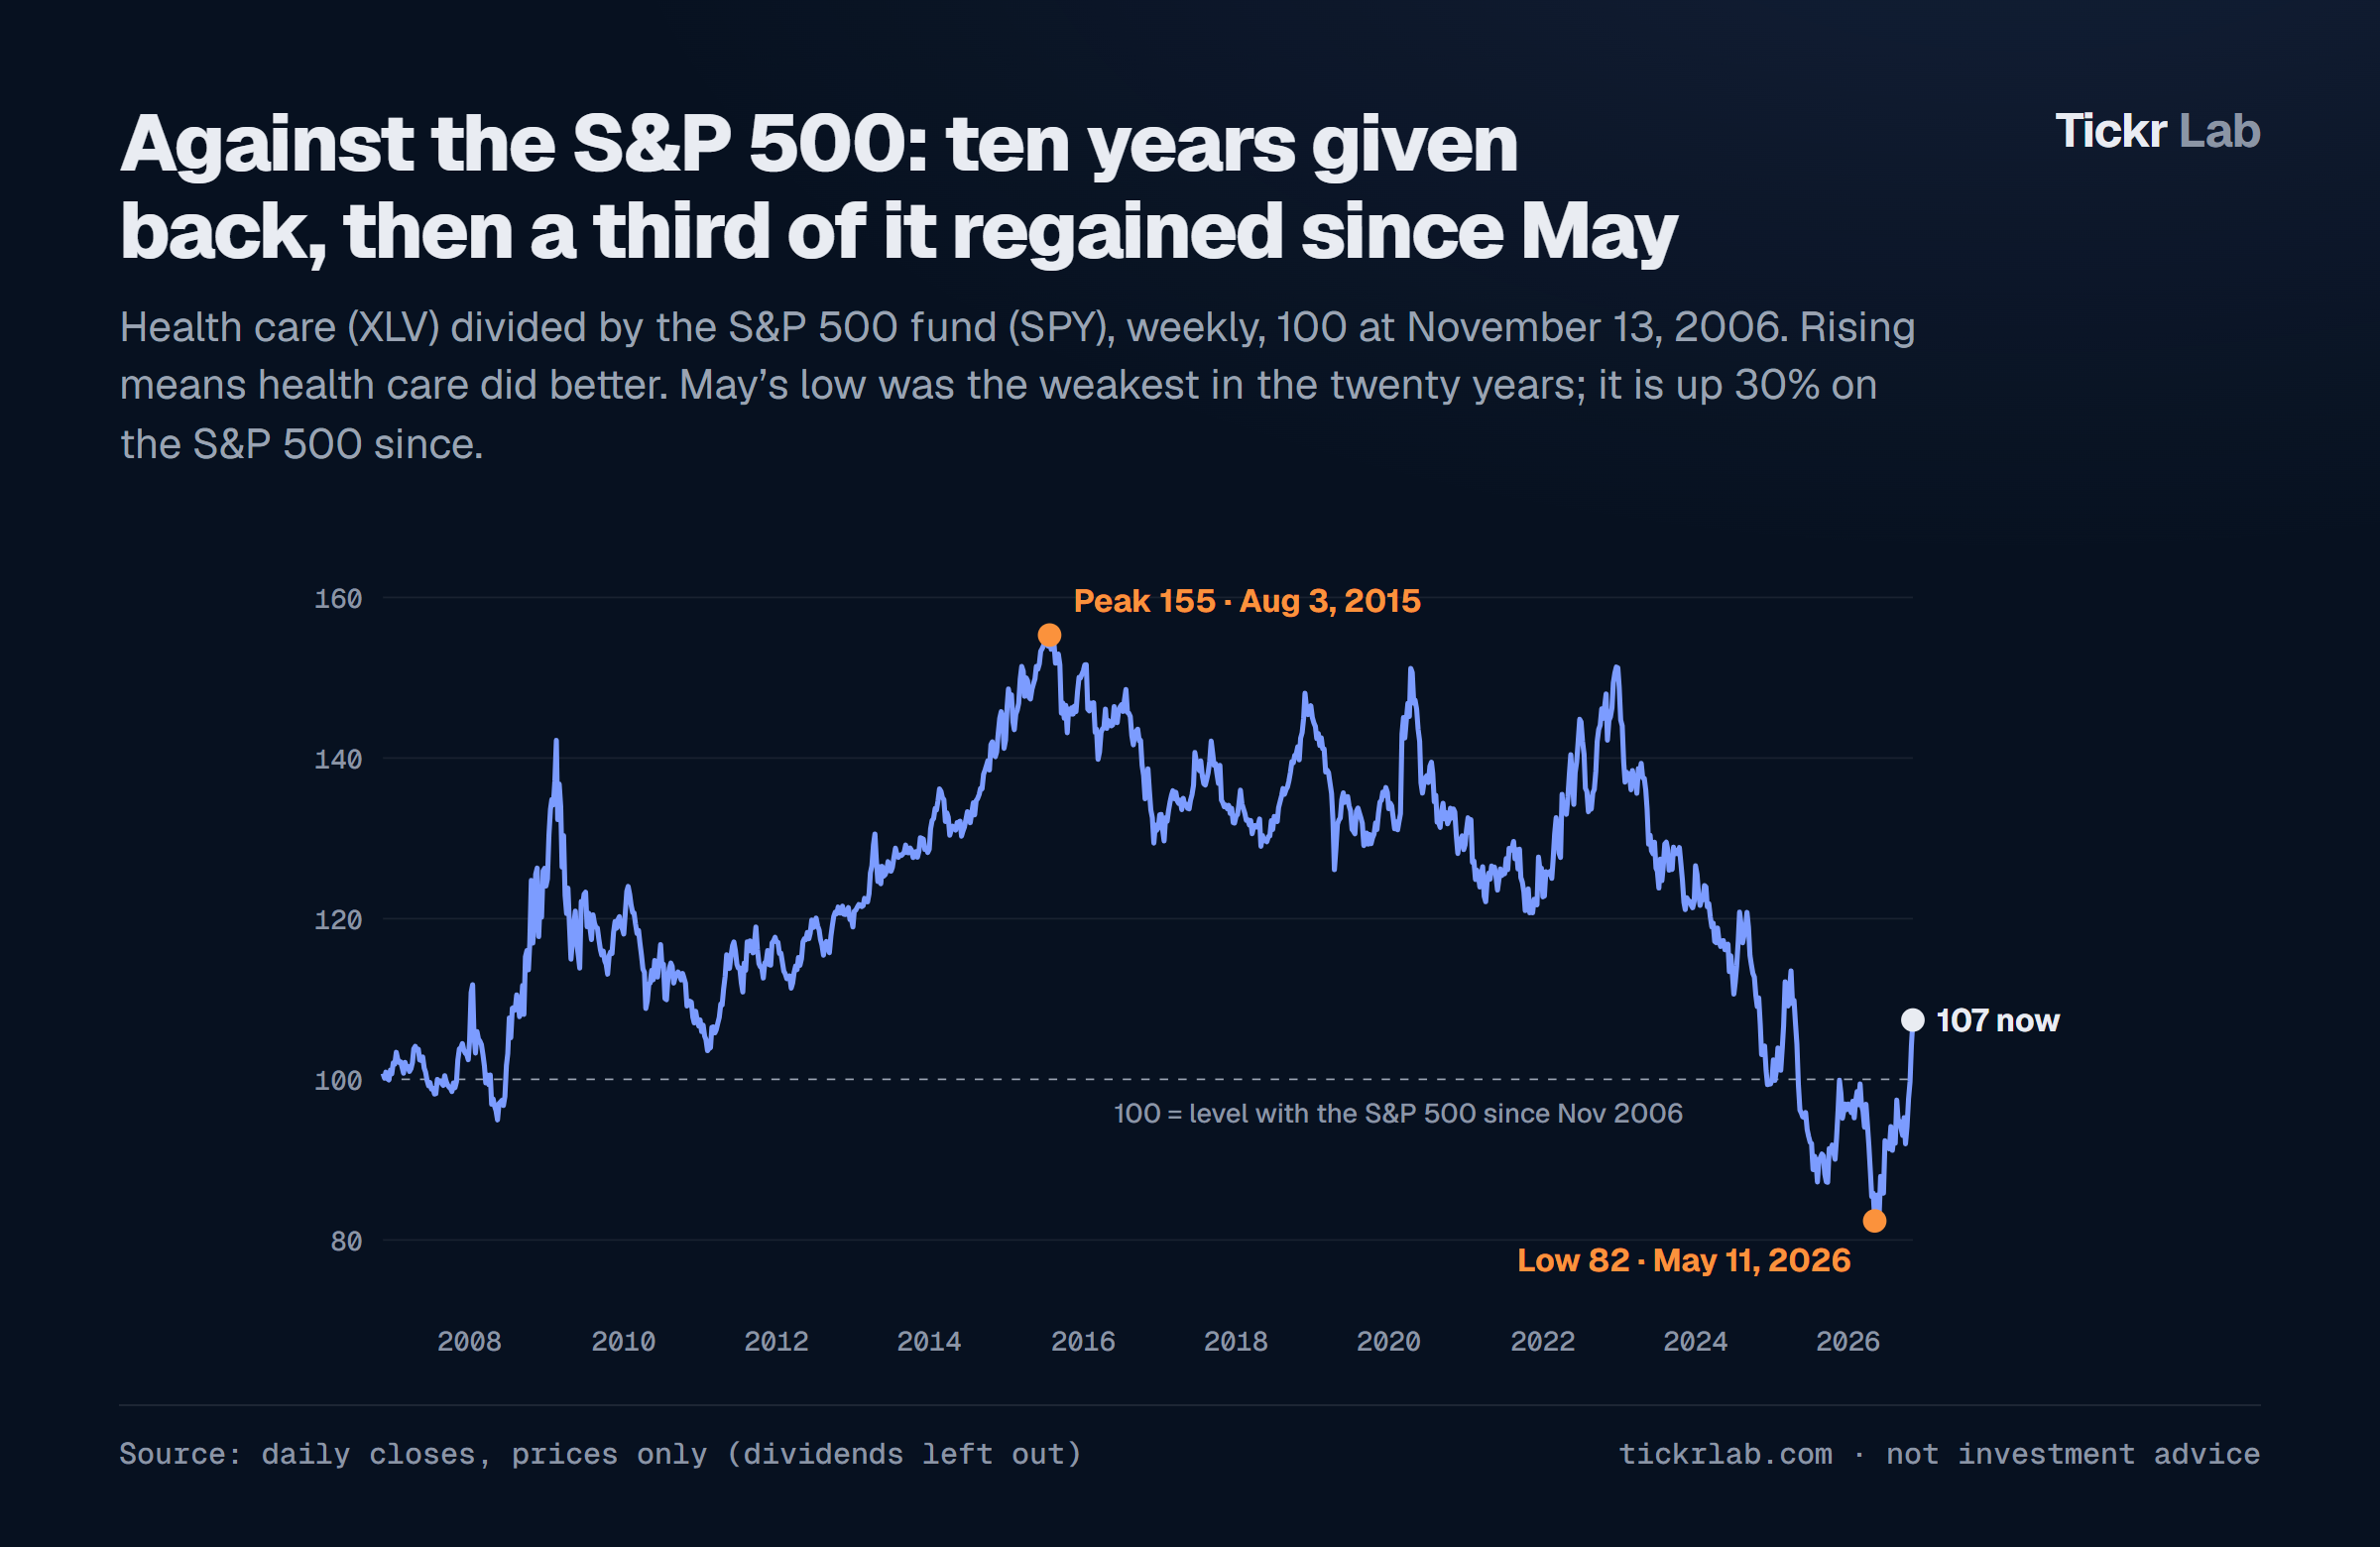
- Against the S&P 500: in May it stood at its weakest in twenty years. It has gained 30% on the index since.
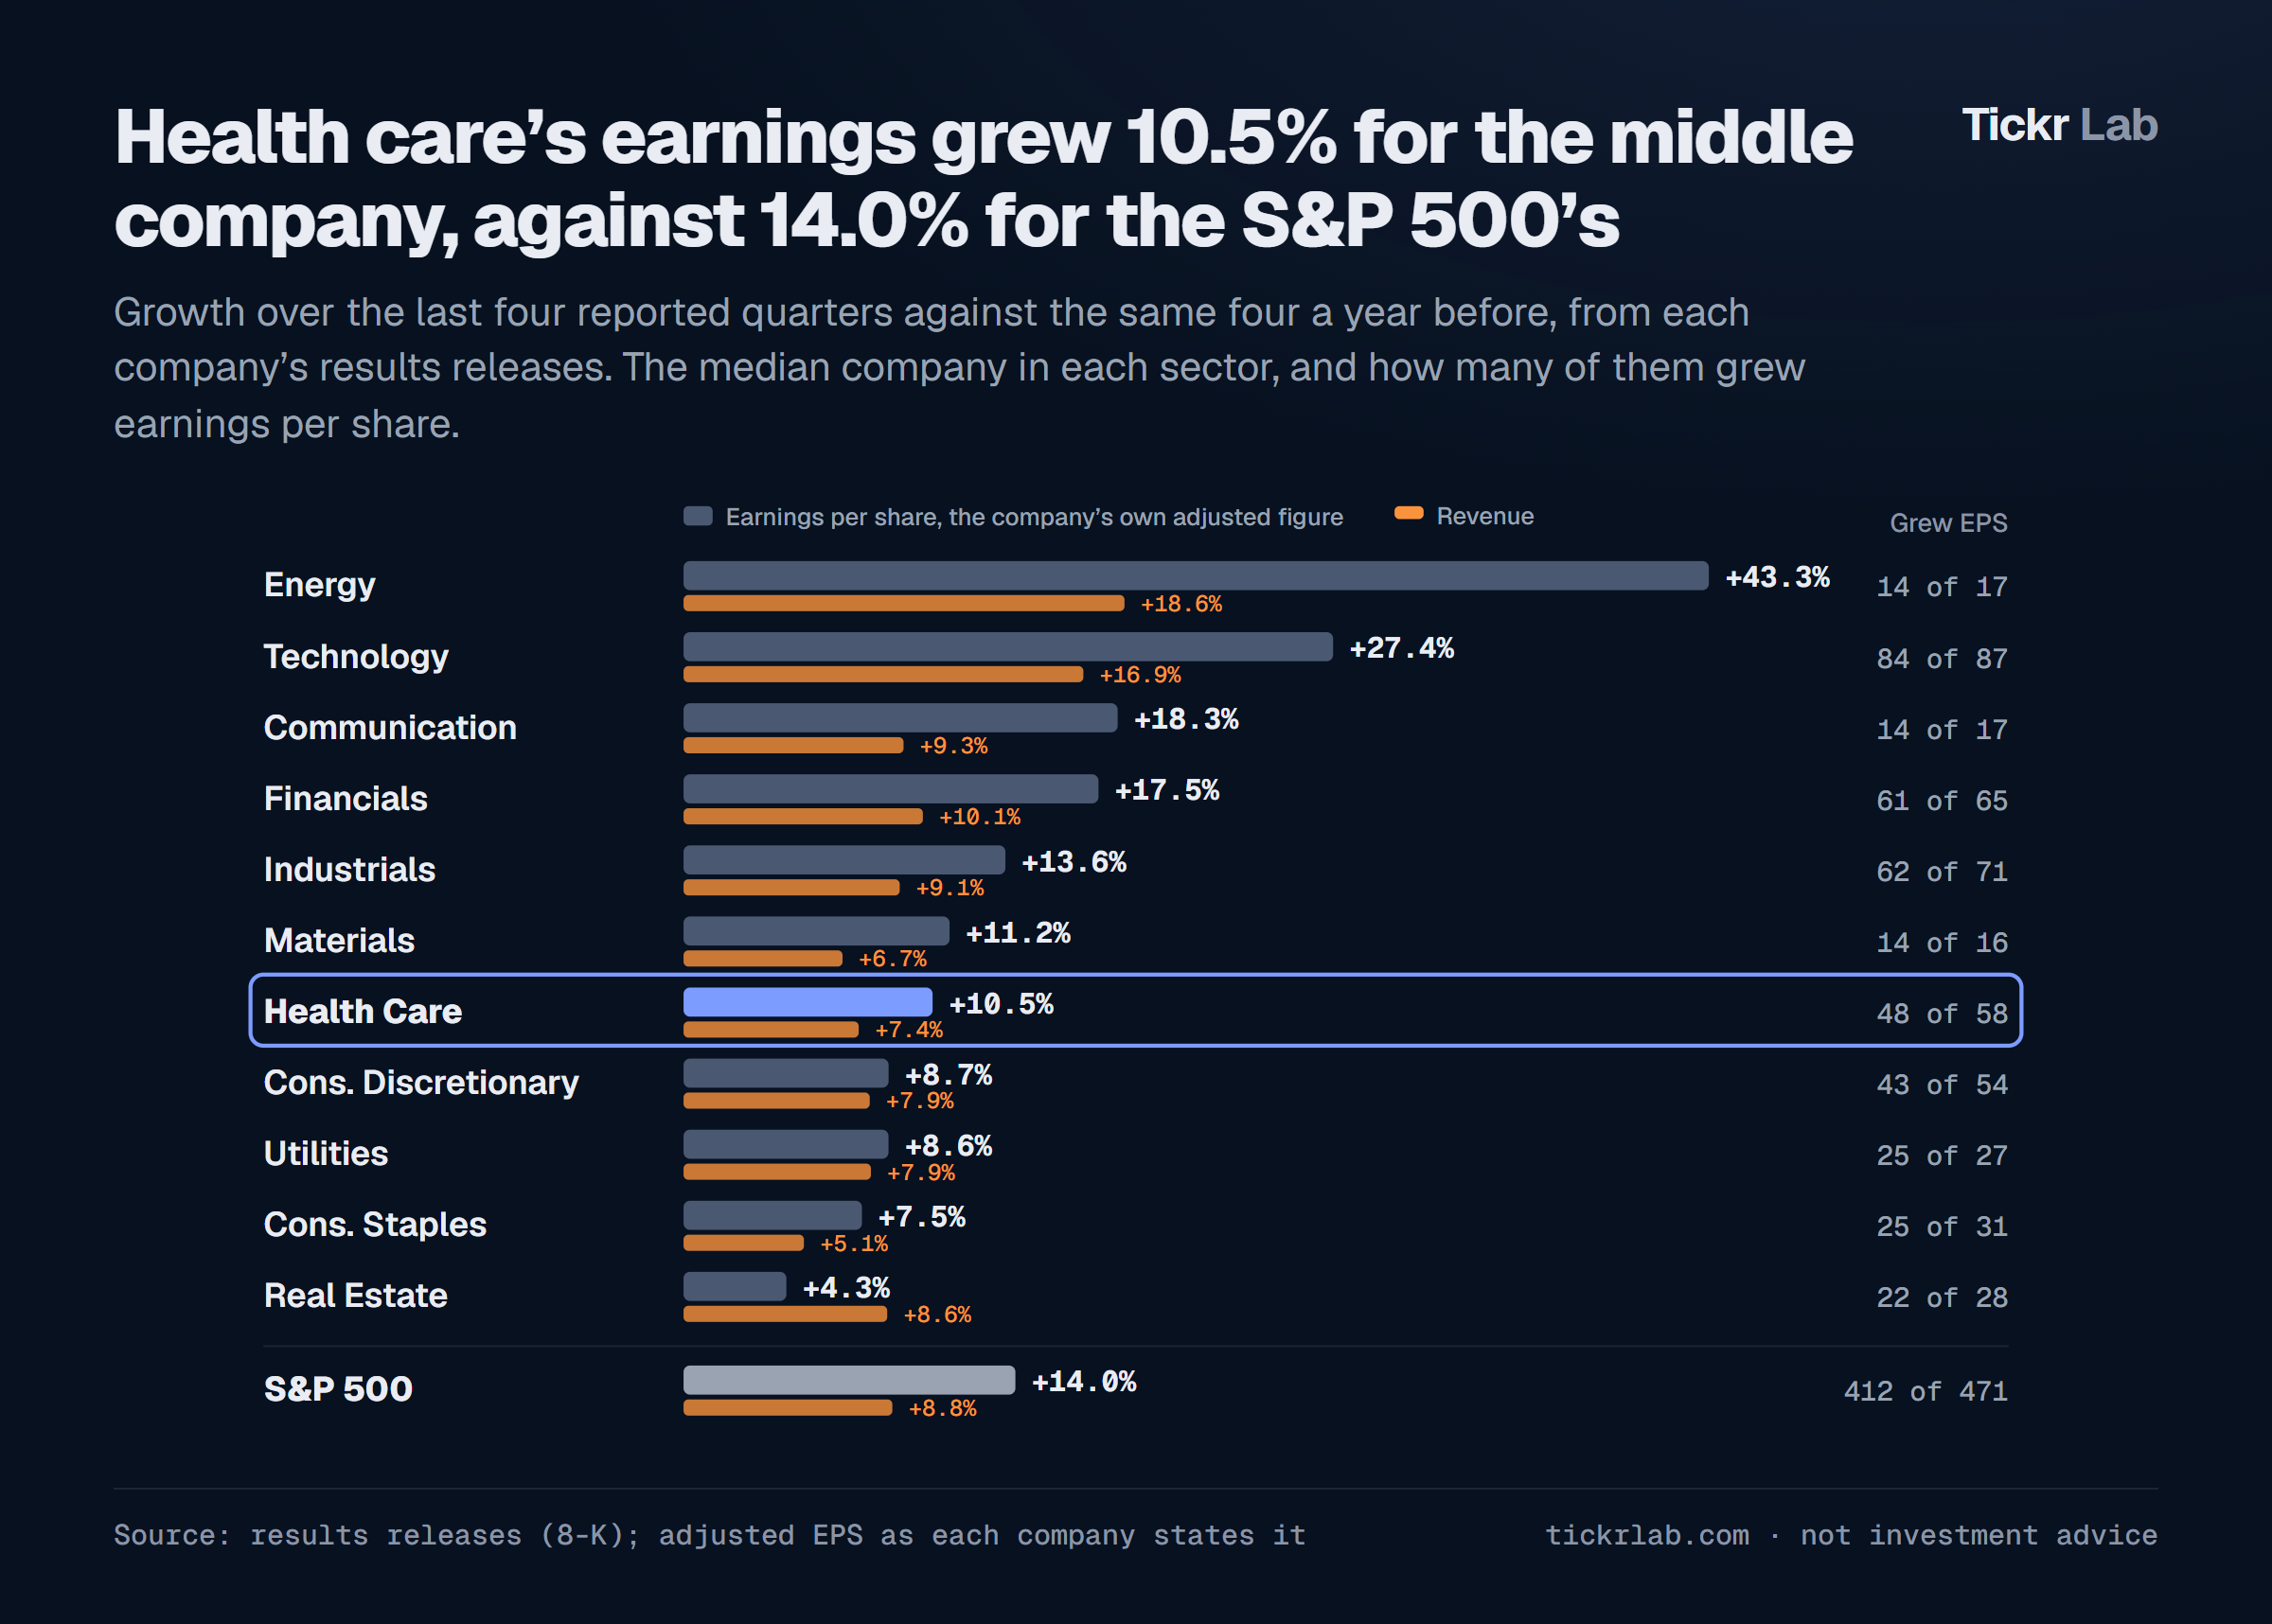
- Earnings: the middle health care company grew earnings per share 10.5% over the last four quarters; the middle S&P 500 company, 14.0%.
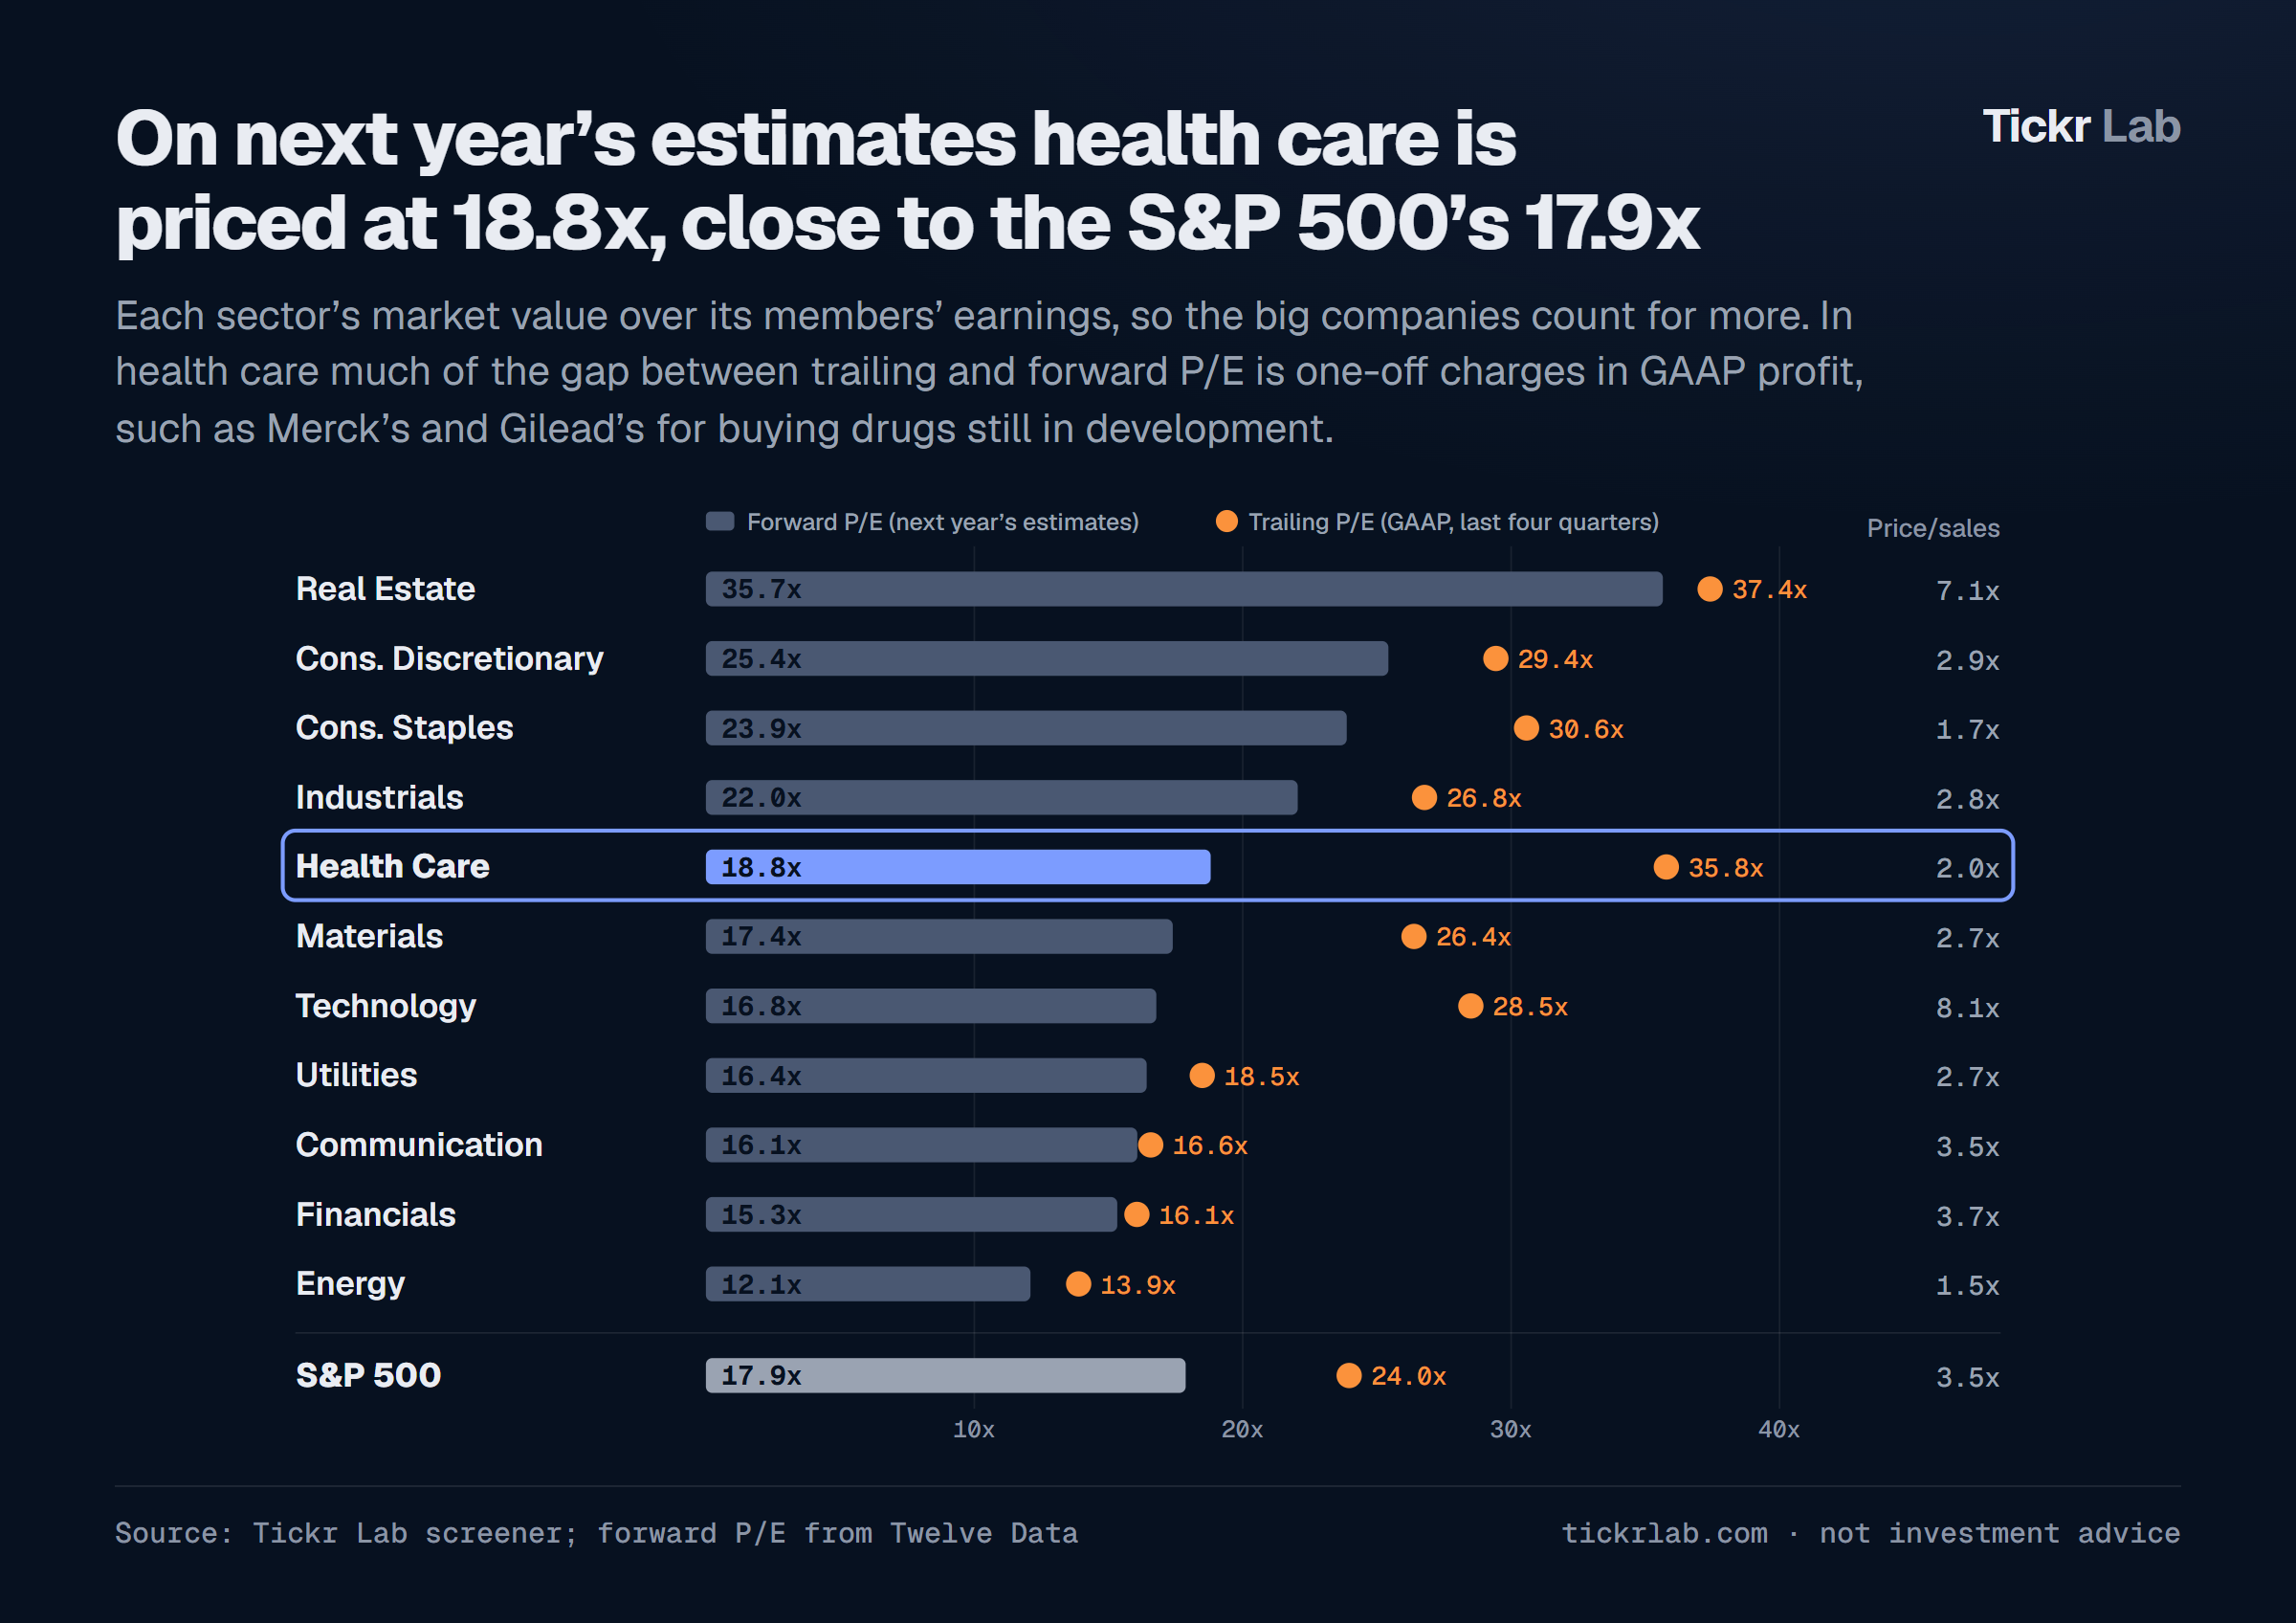
- Valuation: 18.8x next year’s estimates, against 17.9x for the S&P 500. The premium health care carried for most of the last decade has mostly gone.
- Size: 59 companies, 10.2% of the S&P 500. Eli Lilly alone is worth $1.22 trillion; the five largest are 45% of the sector.
Price action
Over one month the fund is +10.5% while technology’s XLK is −19.2%. Over three, five and ten years health care sits mid-table.
Inside the sector
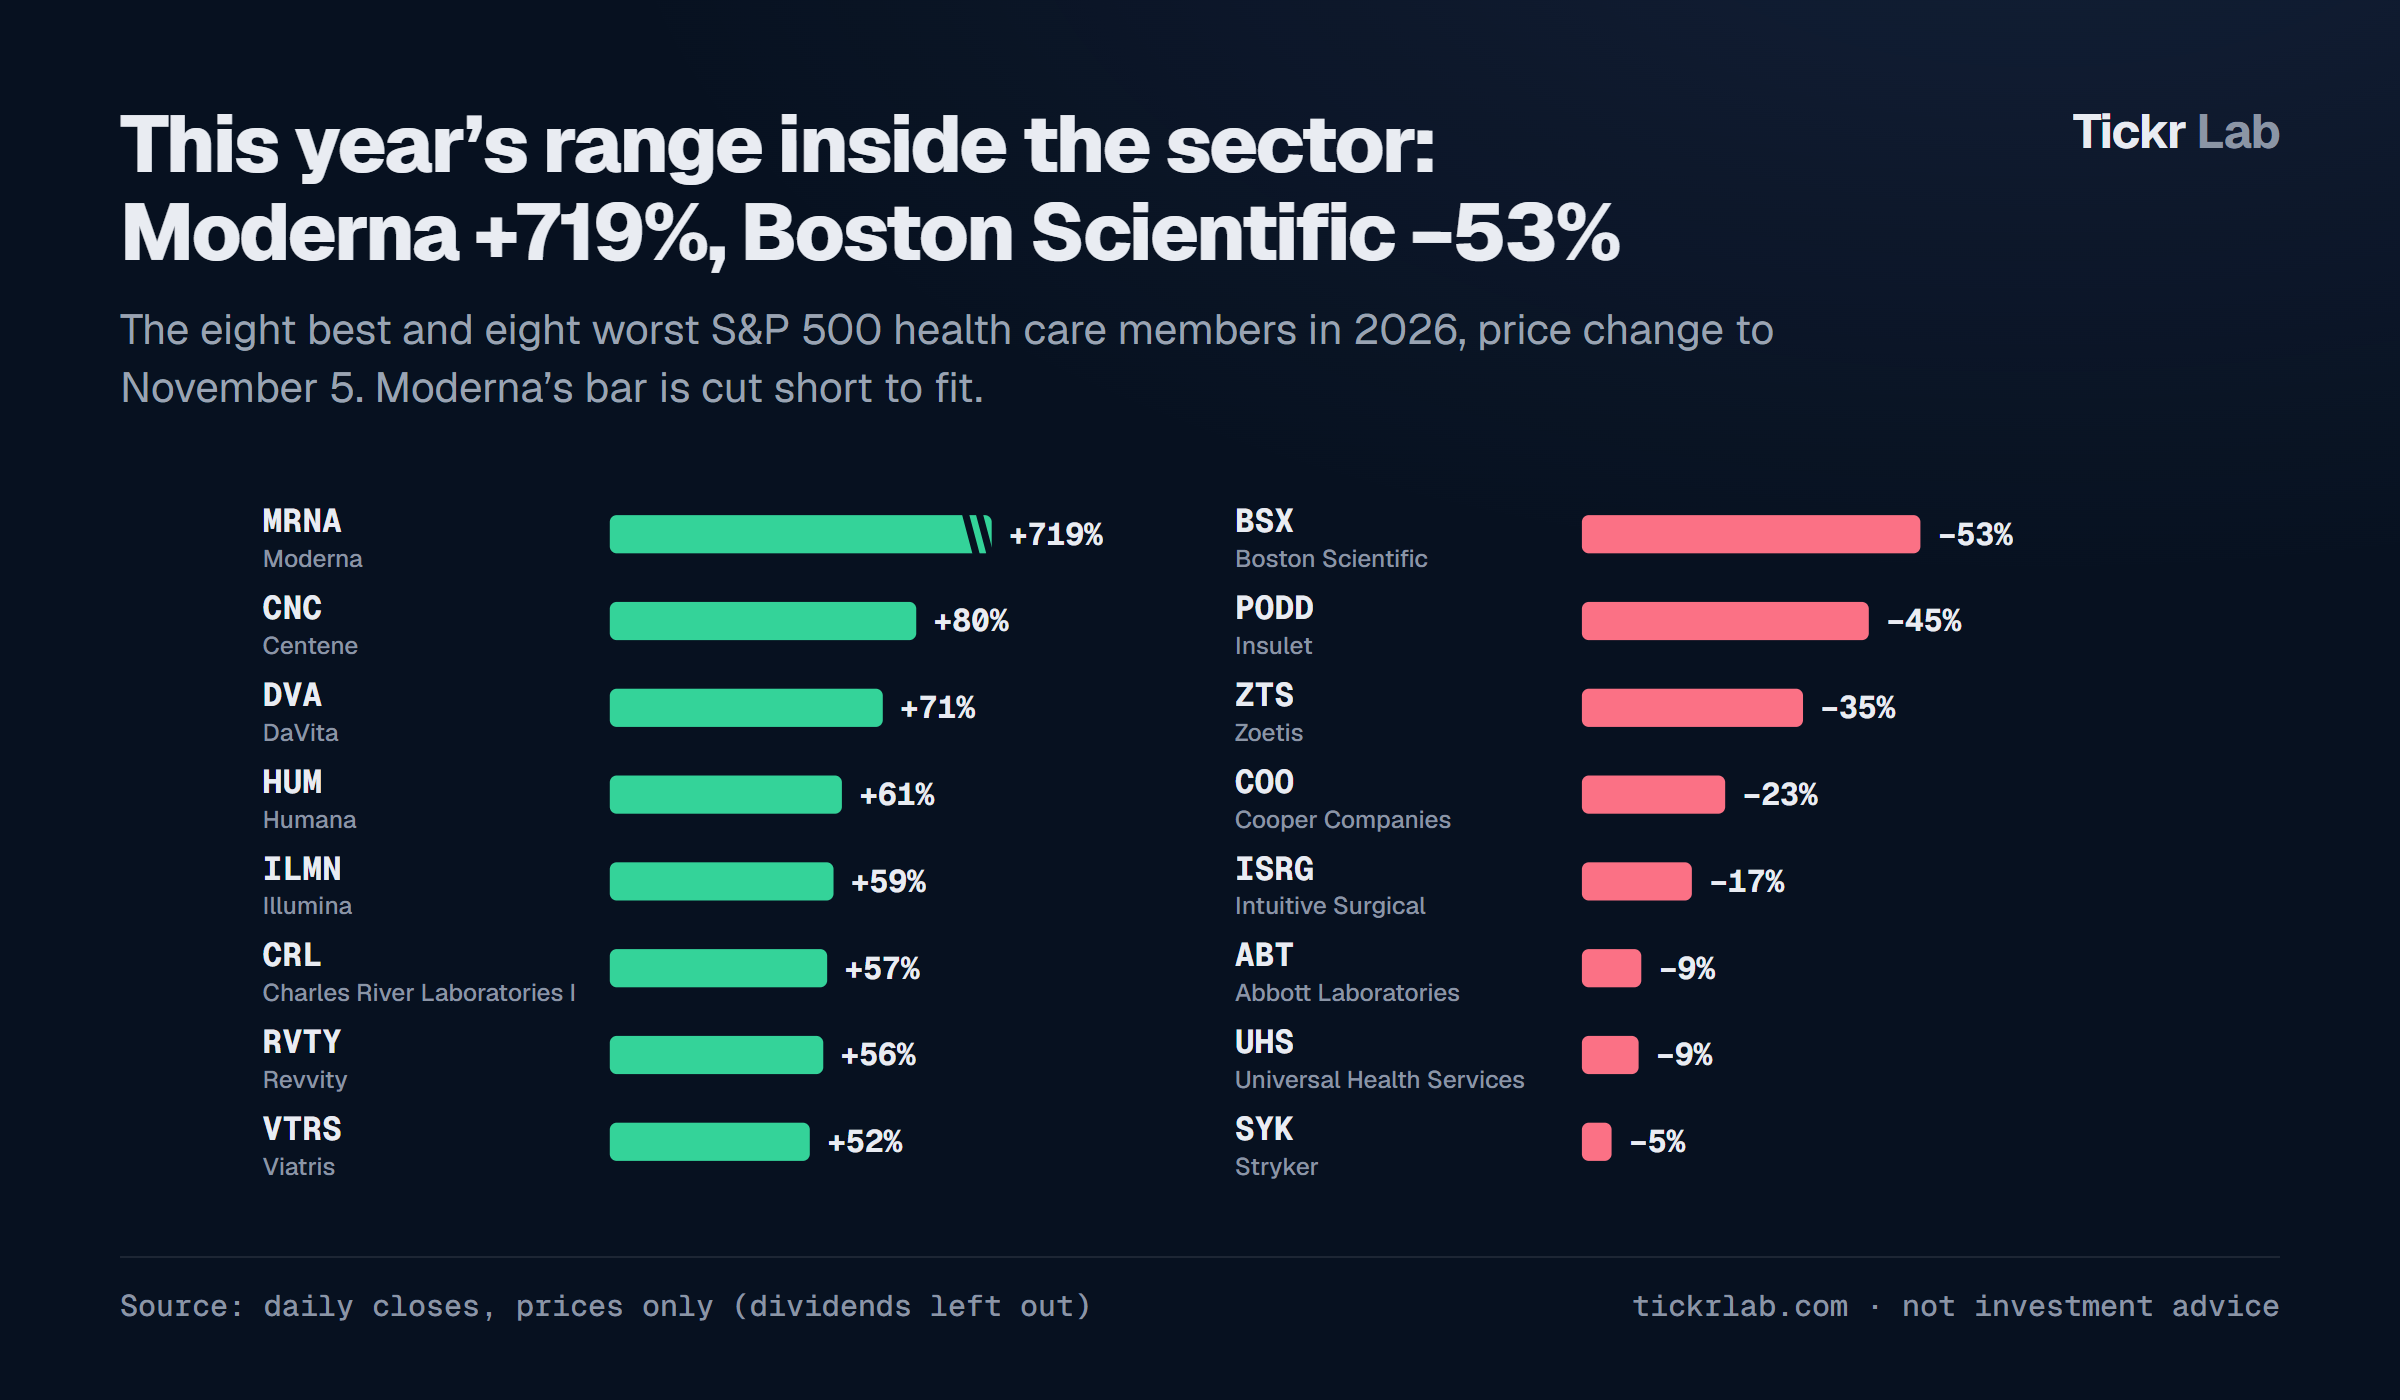
Moderna is up 719% this year, the most in the S&P 500; articles tie it to the melanoma vaccine it is developing with Merck. At the other end, Boston Scientific is −53%: in October it cut its 2026 earnings guidance, and sales of its WATCHMAN heart device fell 5.9% in the quarter, leaving out currency and acquisitions.
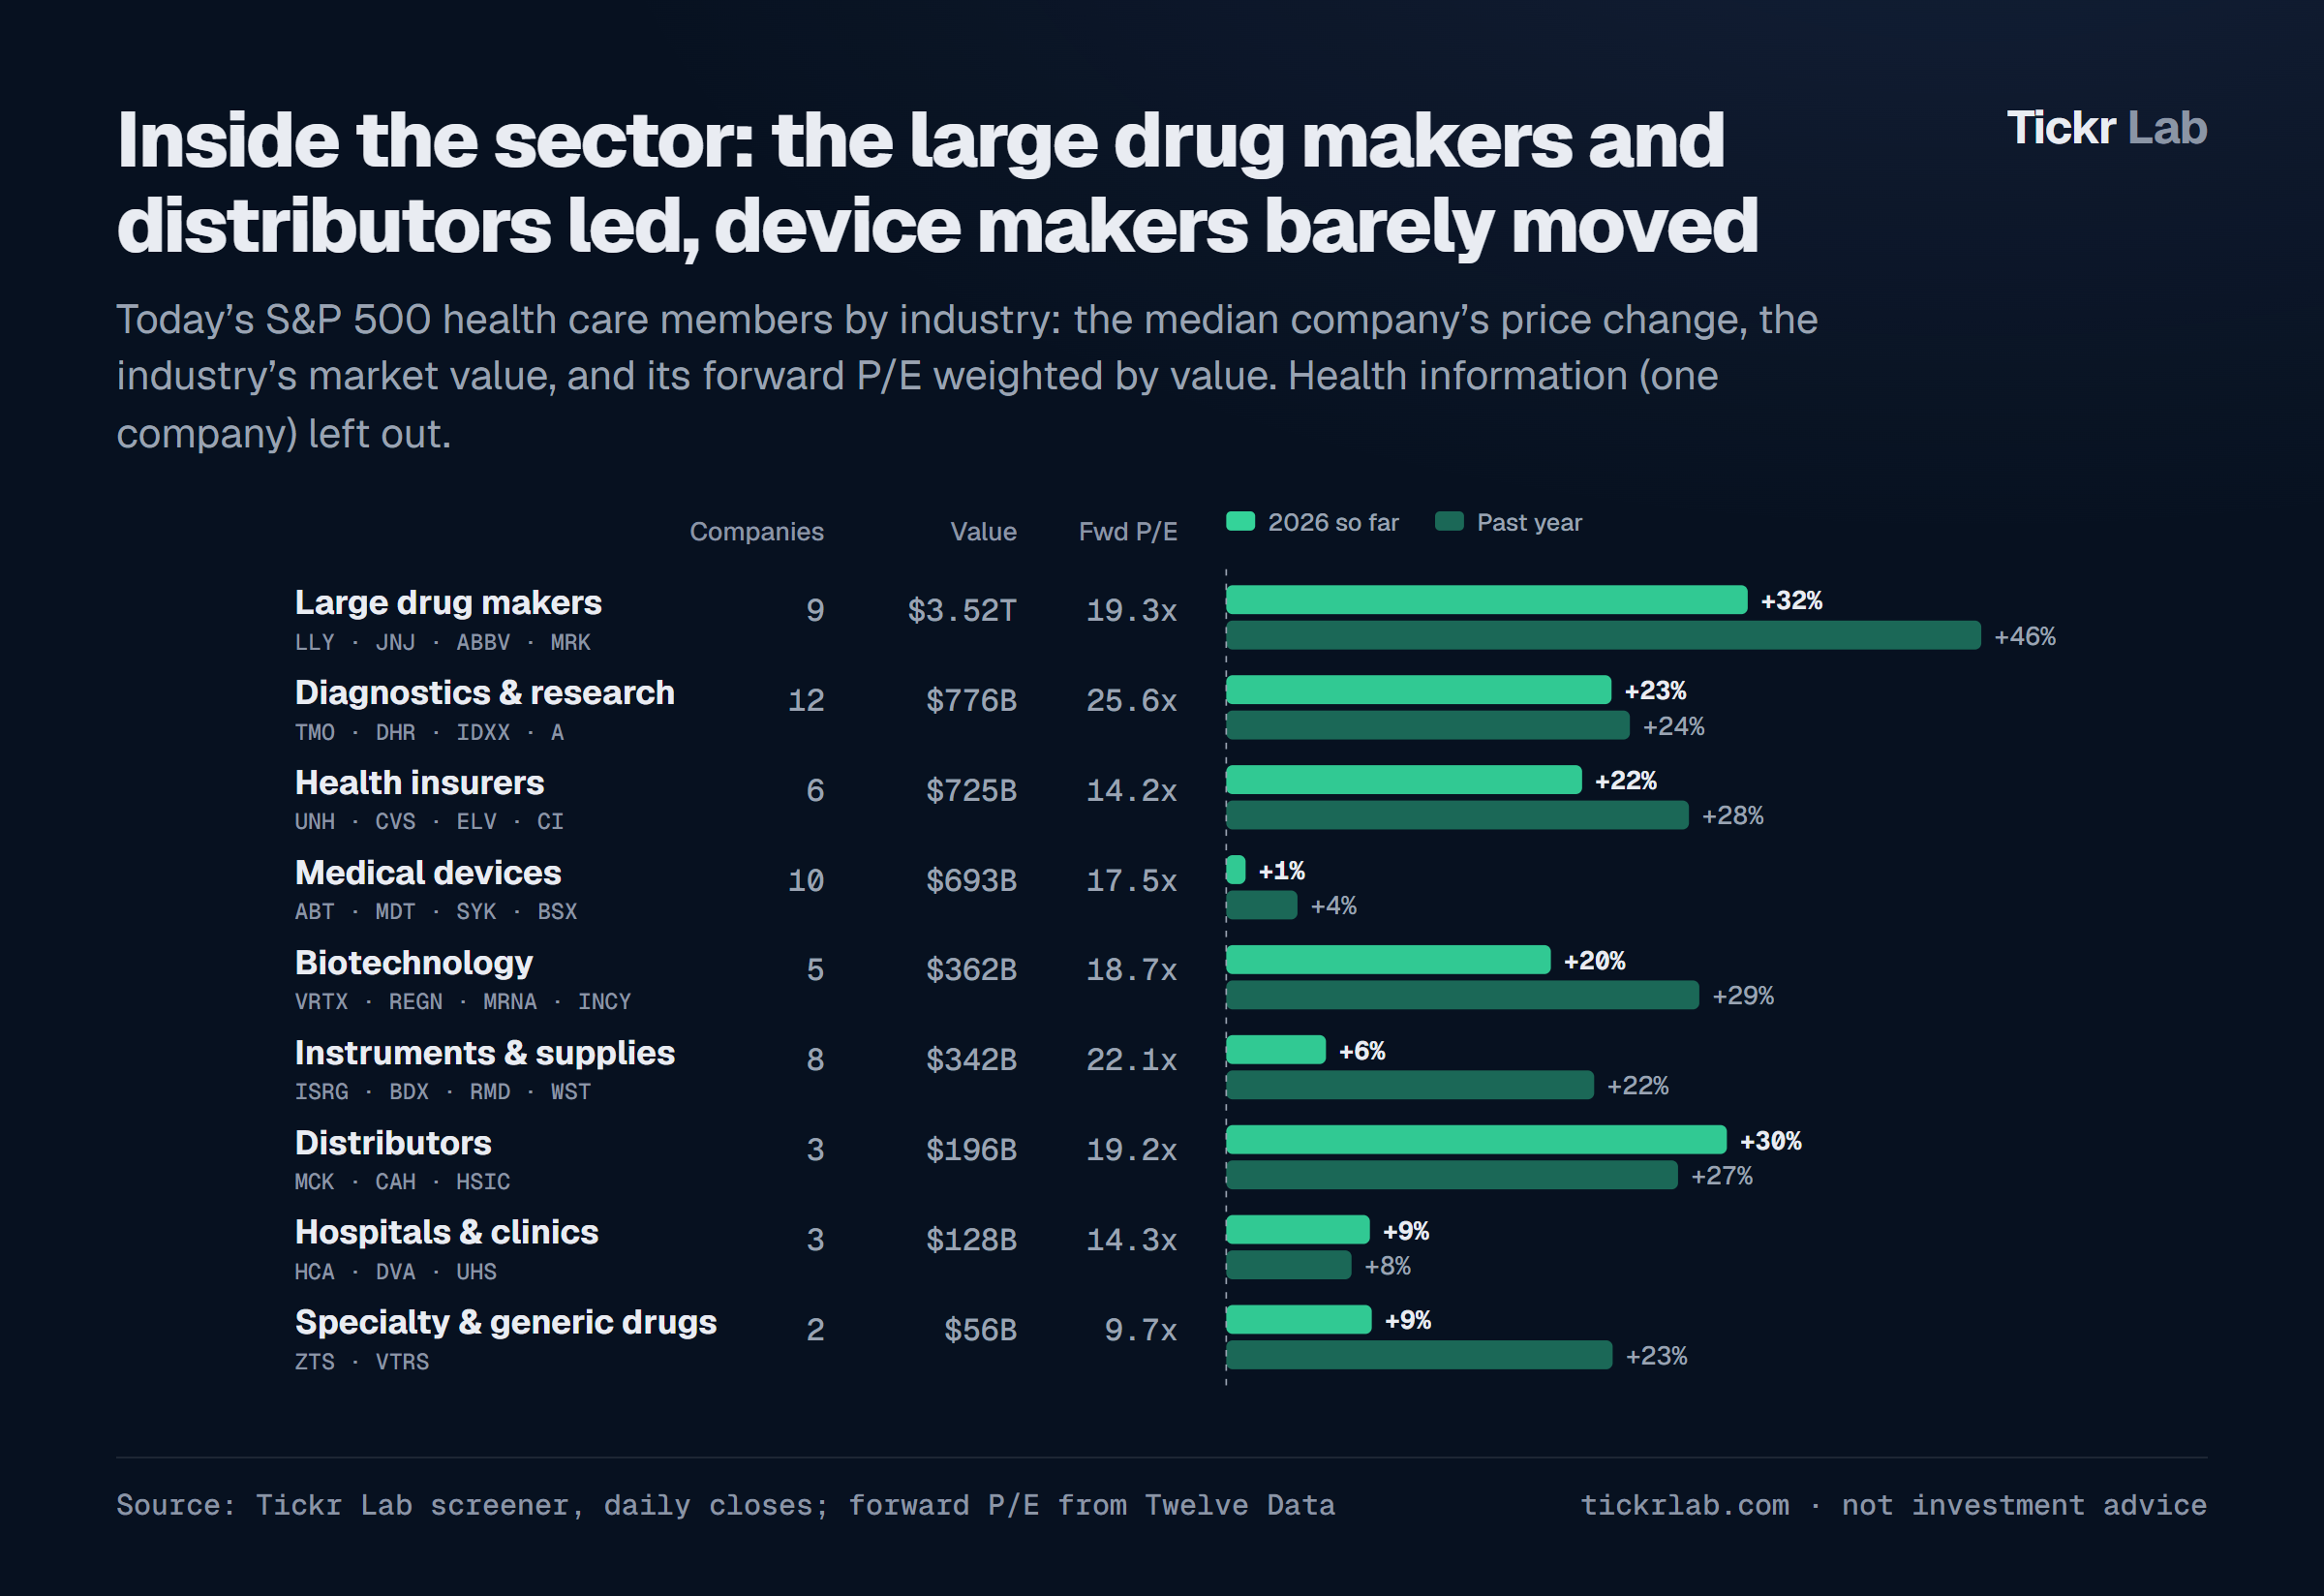
Earnings
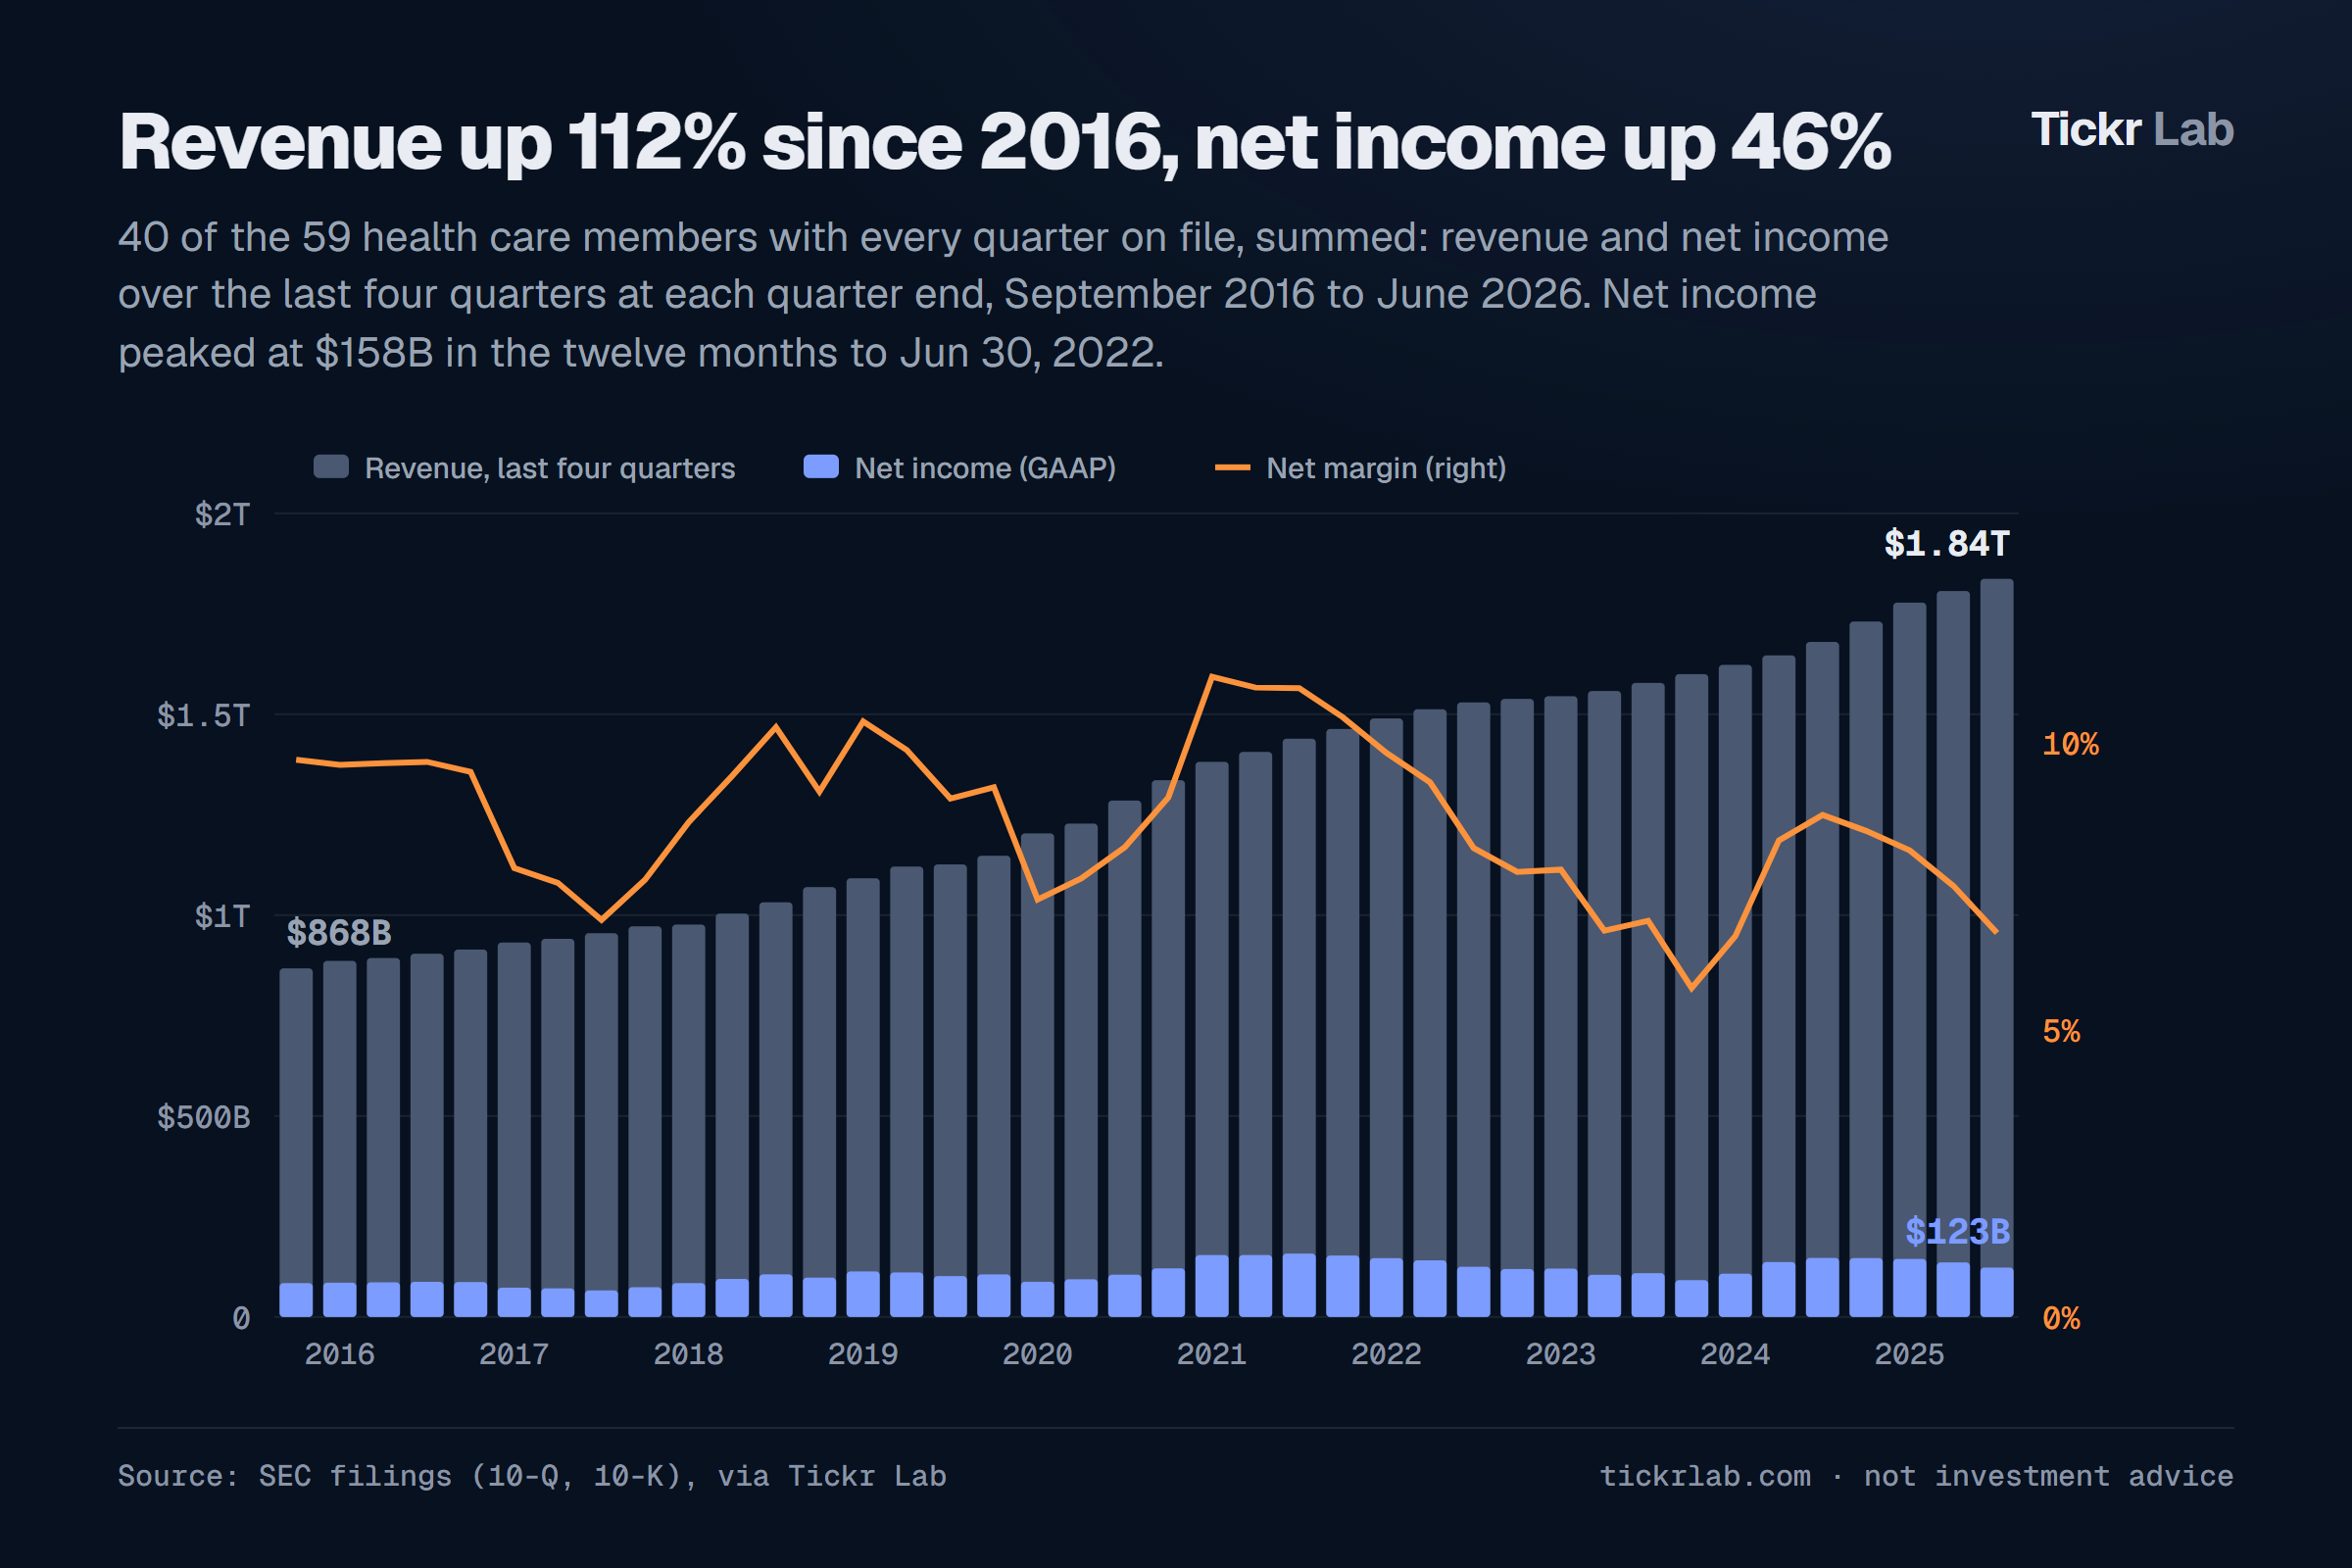
Health care ranks seventh of eleven on earnings growth and ninth on revenue growth (the median company, from each company’s results releases). Over ten years revenue has grown faster than profit: the net margin of the 40 companies with every quarter on file went from 9.7% to 6.7%. Part of that is the insurers and distributors, which turn over a great deal of revenue on thin margins.
Valuation
On next year’s estimates health care is in the middle of the pack. Its trailing GAAP P/E of 35.8x is the second highest of the sectors, inflated by charges such as Merck’s for buying Cidara and Terns and Gilead’s for drugs in development. Price to sales (2.0x) is low because UnitedHealth, CVS and McKesson book hundreds of billions in revenue.
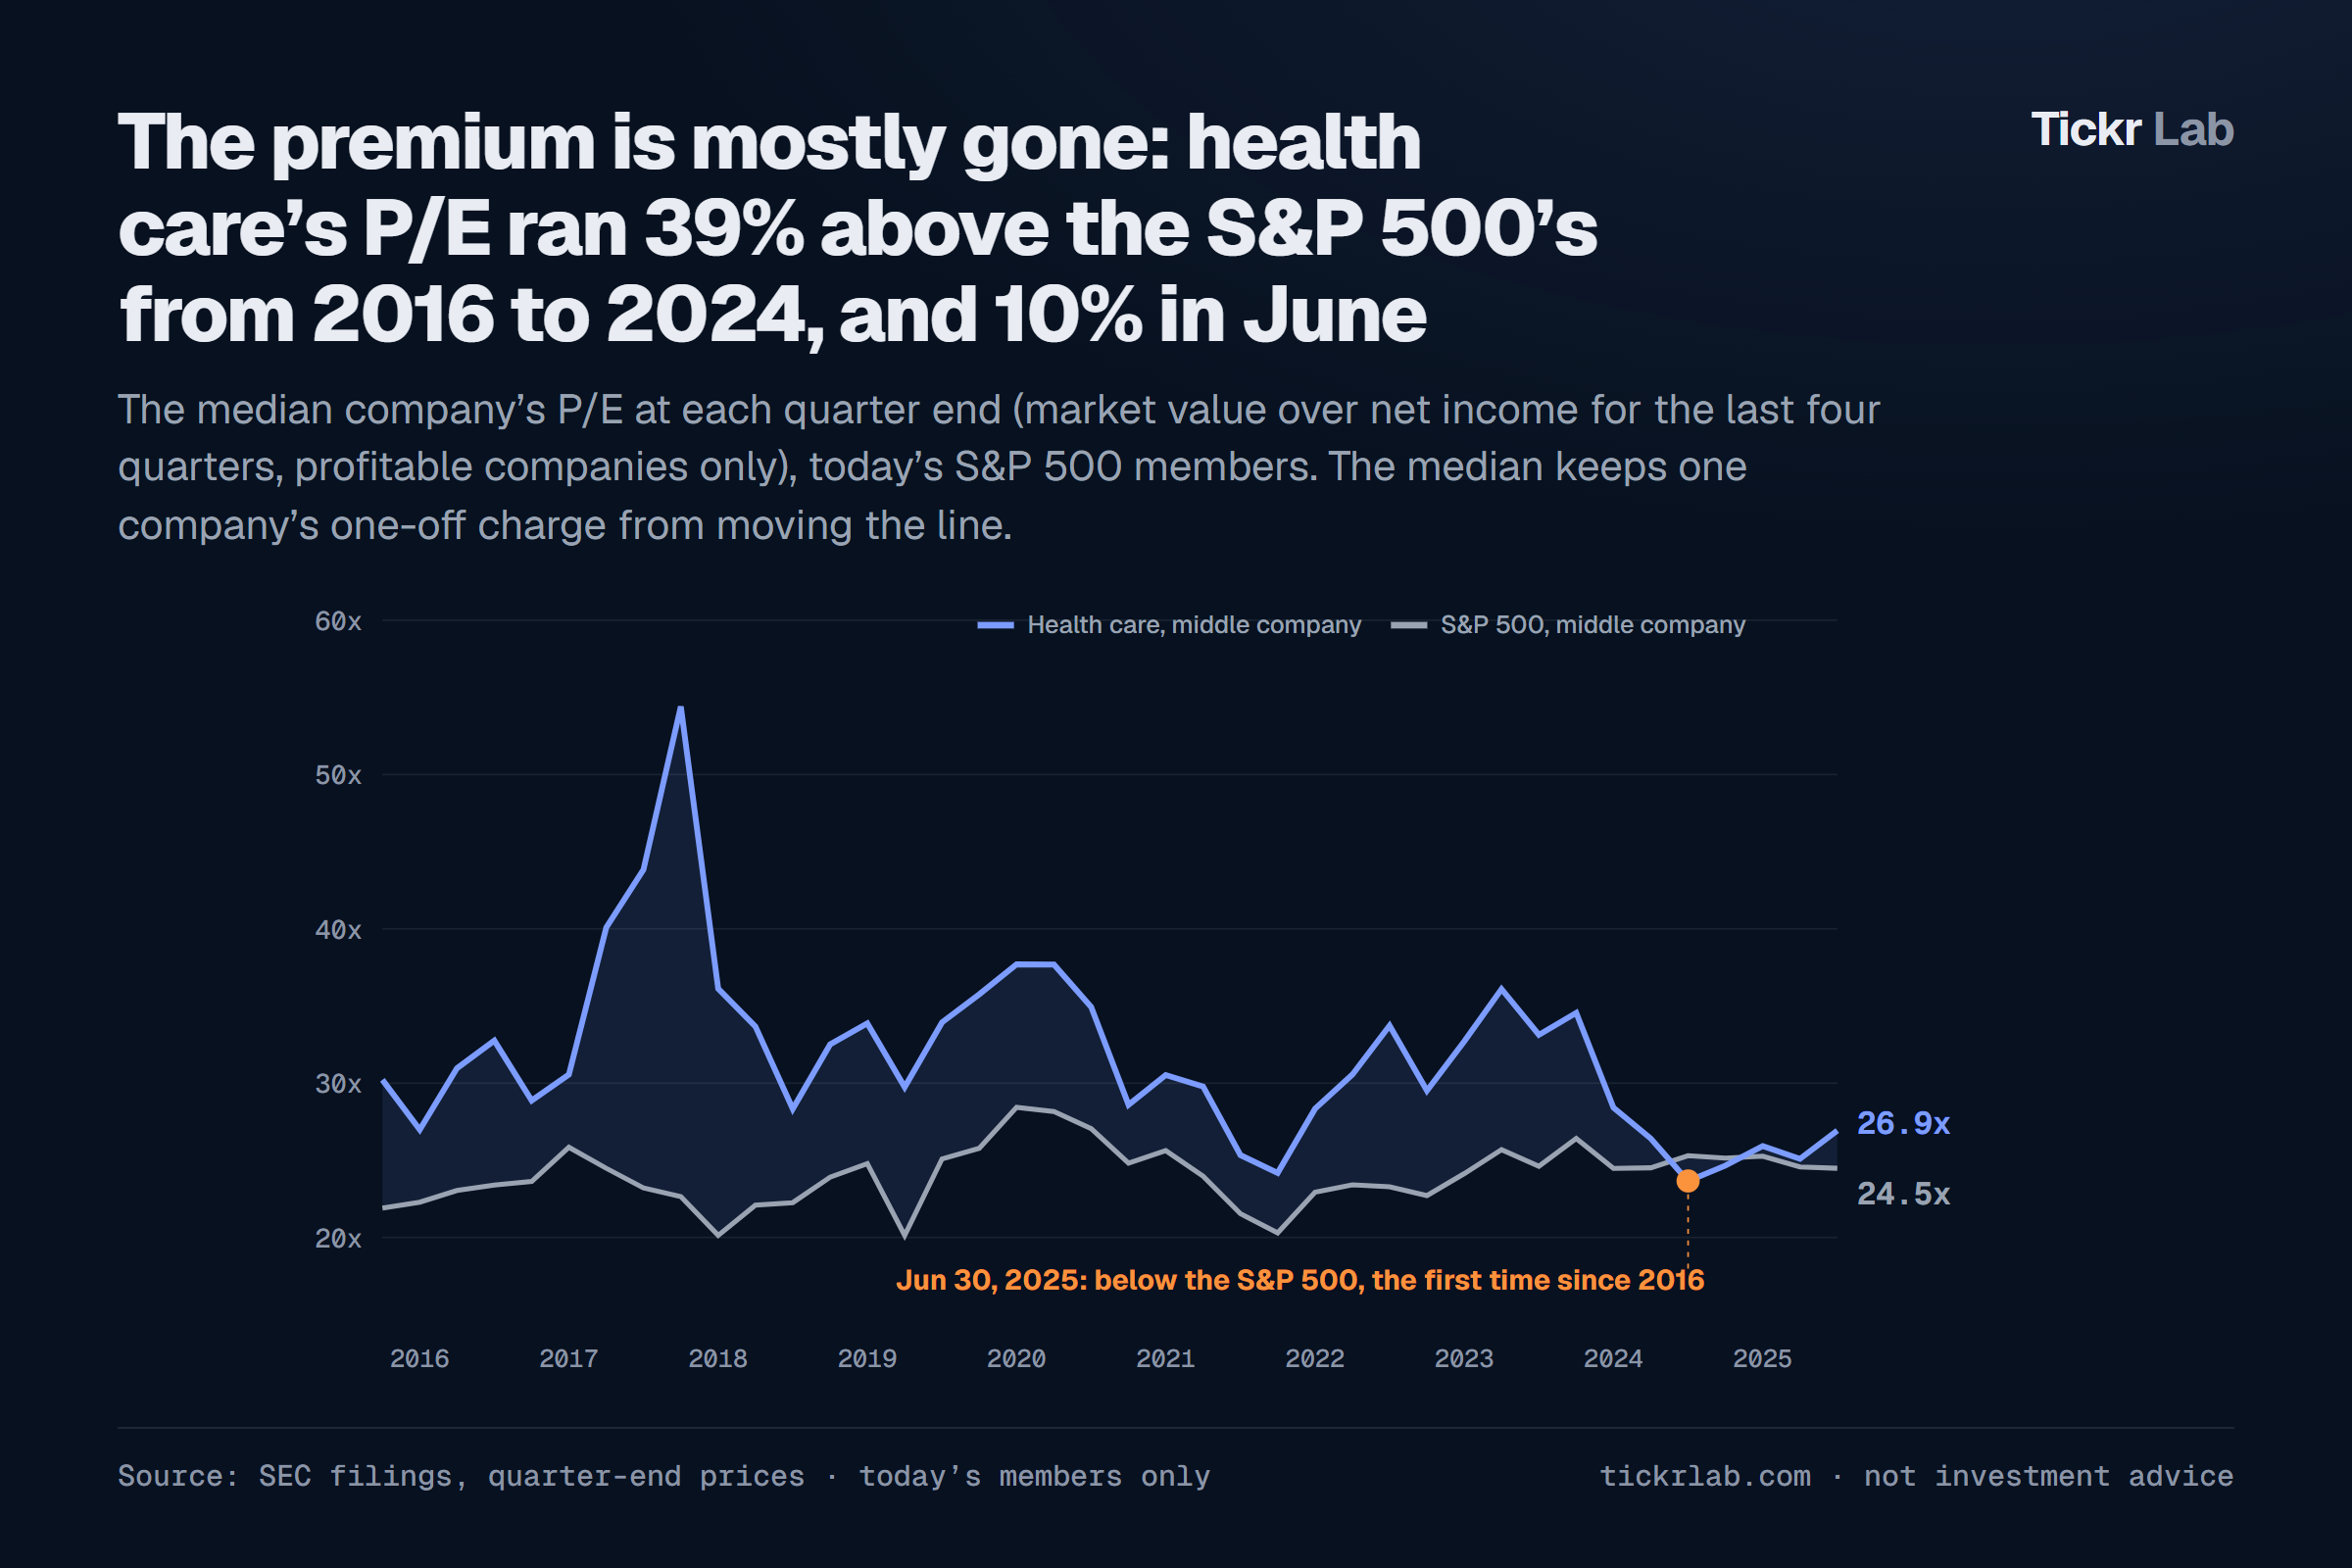
The median company tells the longer story: from 2016 to 2024 health care’s P/E ran 39% above the S&P 500’s. In June 2025 it fell below it, the first time since our data begin in 2016. In June 2026 it was 10% above.
The key stocks
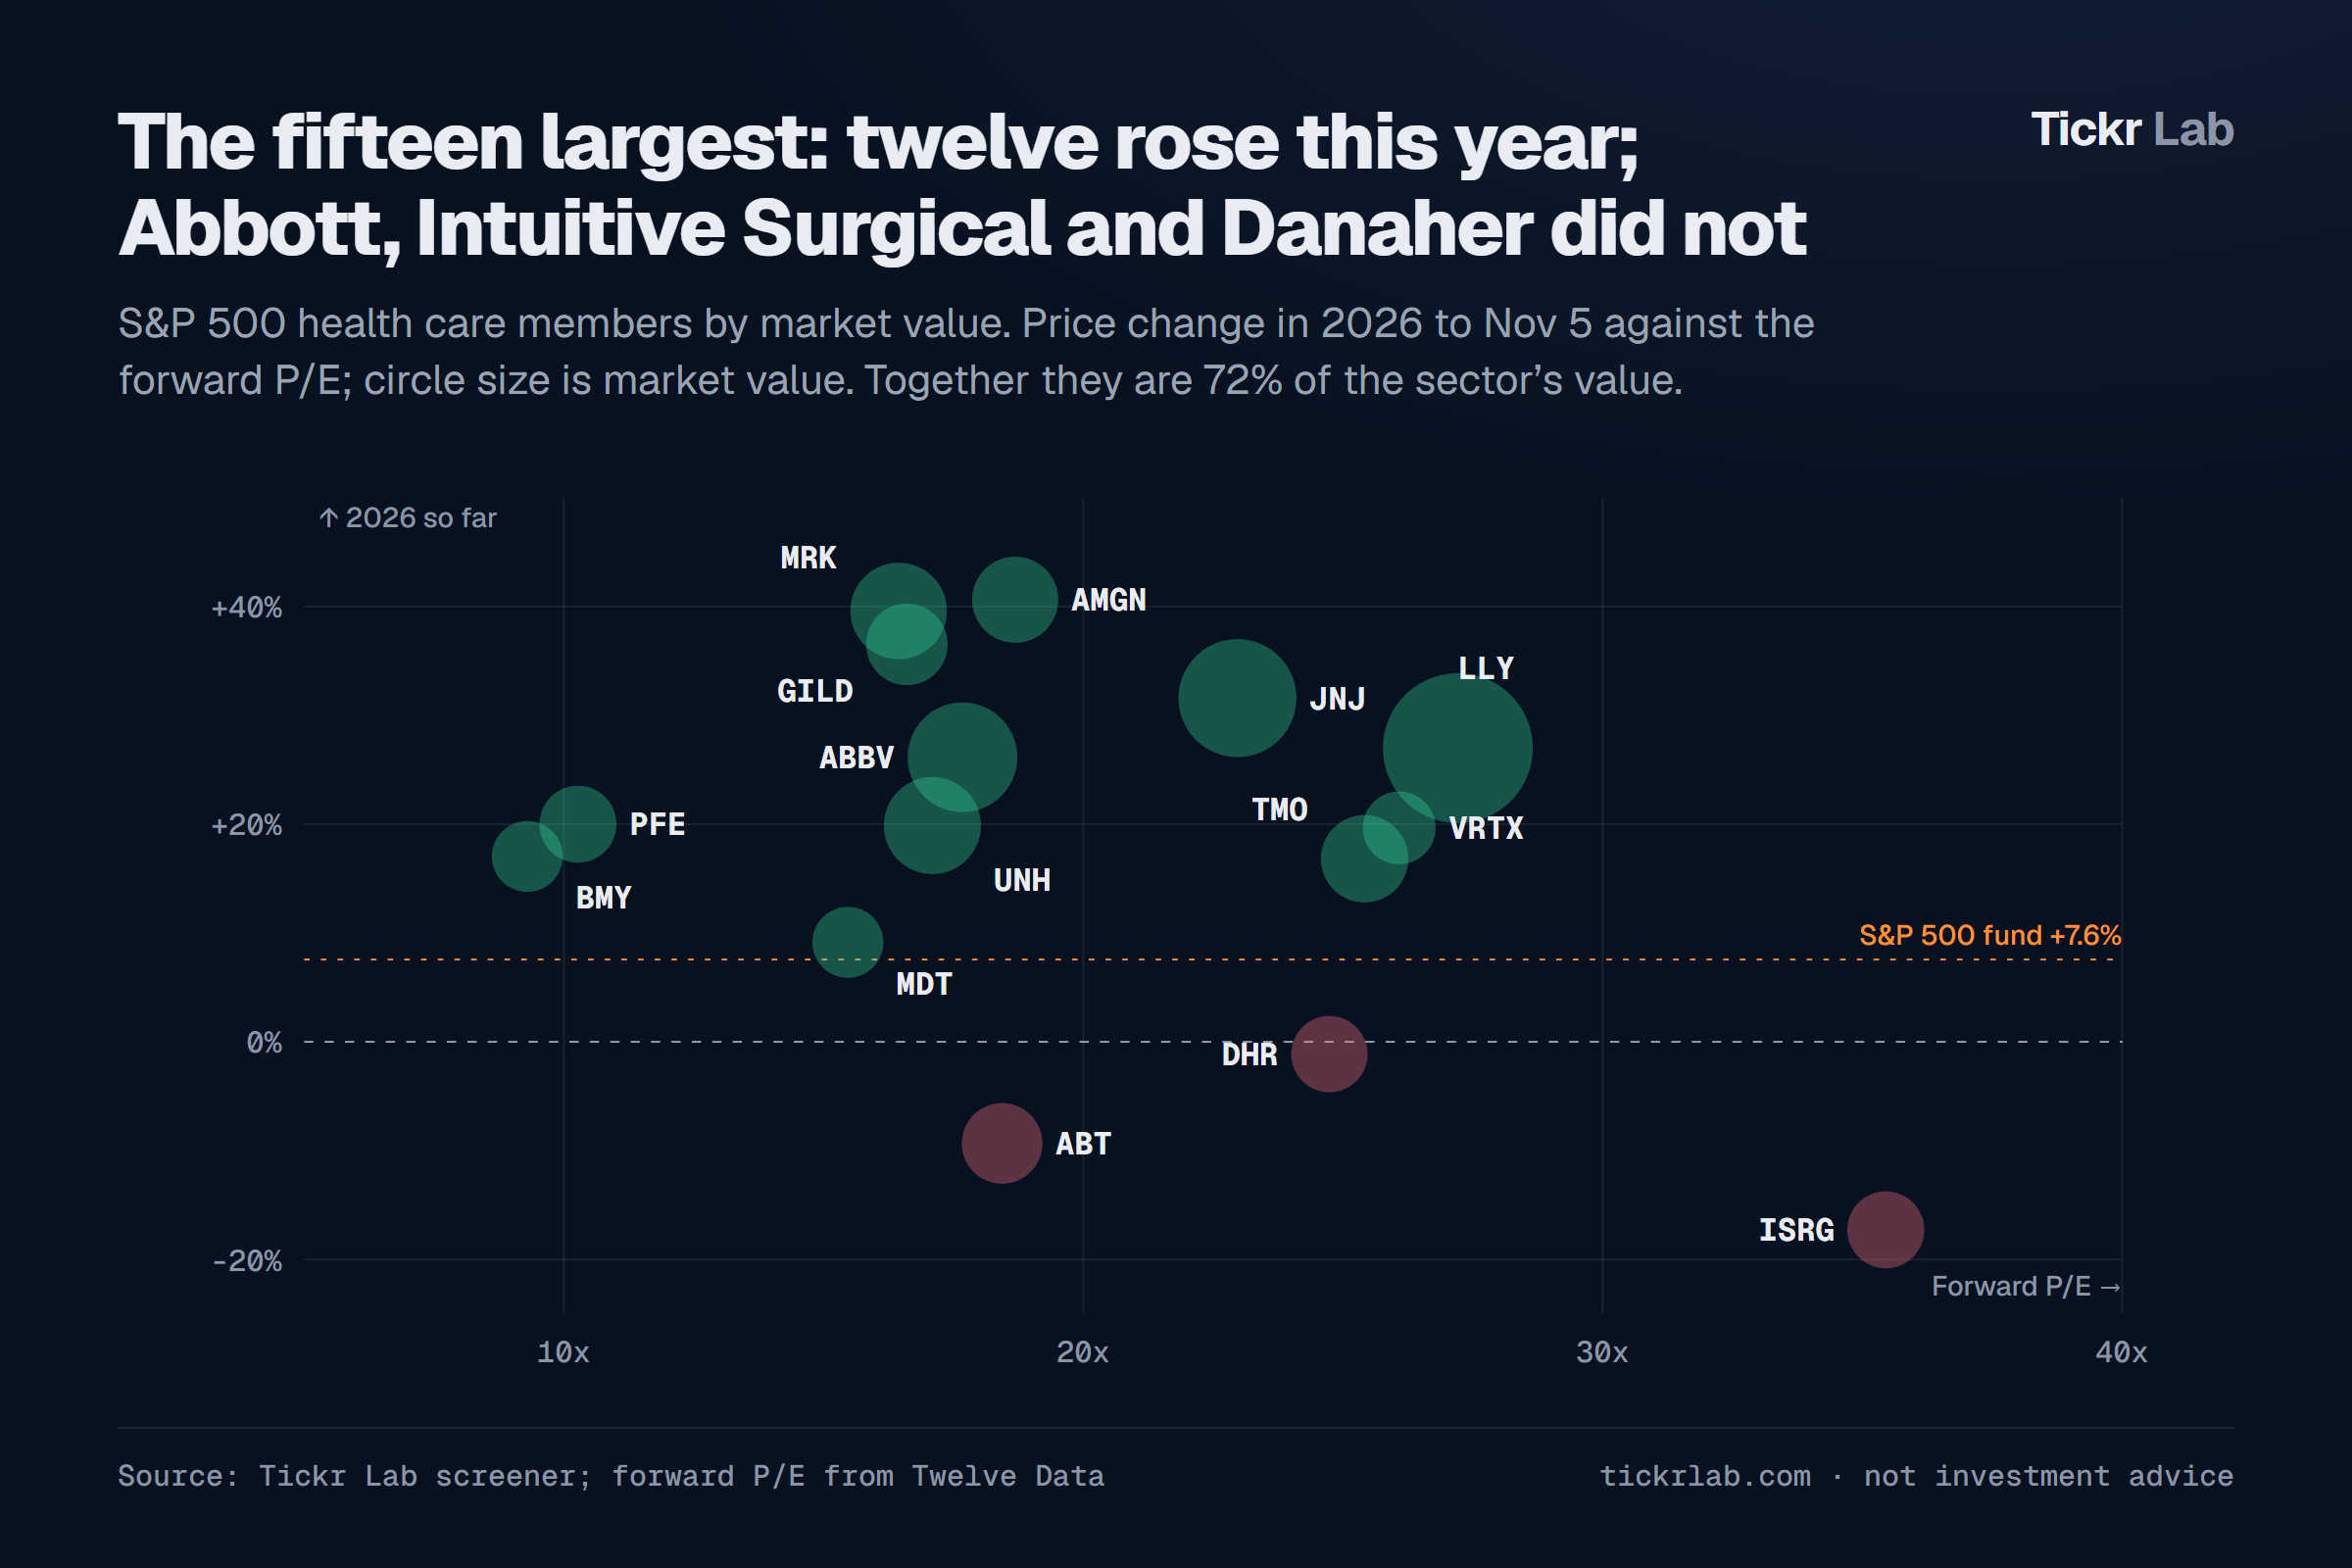
| Company | Value | 2026 | 1 year | Off high | Fwd P/E | Revenue | EPS | Signal | |---|--:|--:|--:|--:|--:|--:|--:|---| | Eli Lilly | $1.22T | +27% | +50% | −6% | 27.2x | +46% | +45% | Neutral · No clean entry | | Johnson & Johnson | $641B | +32% | +46% | −3% | 23.0x | +8% | +3% | Strong – Elevated Risk · fundamentals not OK | | AbbVie | $521B | +26% | +34% | −5% | 17.7x | +11% | +36% | Very Strong · uptrend, clean entry, near high, strong fundamentals | | UnitedHealth | $363B | +20% | +20% | −14% | 17.1x | +3% | −3% | Strong – Elevated Risk · fundamentals not OK | | Merck | $357B | +40% | +75% | −6% | 16.4x | +5% | −64% | Strong – Elevated Risk · fundamentals not OK | | Thermo Fisher | $262B | +17% | +20% | −5% | 25.4x | +8% | +10% | Strong · clean entry, fundamentals OK | | Amgen | $249B | +41% | +55% | −5% | 18.7x | +8% | +6% | Neutral · No clean entry | | Gilead | $208B | +37% | +36% | −5% | 16.6x | +7% | to a loss | Neutral · No clean entry | | Abbott | $200B | −9% | −10% | −14% | 18.4x | +10% | +8% | Neutral · No clean entry | | Intuitive Surgical | $170B | −17% | −13% | −22% | 35.5x | +20% | +26% | Neutral · No clean entry | | Pfizer | $170B | +20% | +23% | −5% | 10.3x | +1% | −5% | Neutral · Weak fundamentals | | Danaher | $165B | −1% | +6% | −7% | 24.7x | +6% | +8% | Strong · clean entry, fundamentals OK | | Vertex | $139B | +20% | +29% | −5% | 26.1x | +10% | +9% | Strong – Elevated Risk · fundamentals not OK | | Medtronic | $126B | +9% | +16% | −1% | 15.5x | +10% | +3% | Neutral · Extended — wait for a pullback | | Bristol-Myers Squibb | $126B | +17% | +38% | −8% | 9.3x | +4% | −5% | Strong – Elevated Risk · fundamentals not OK |
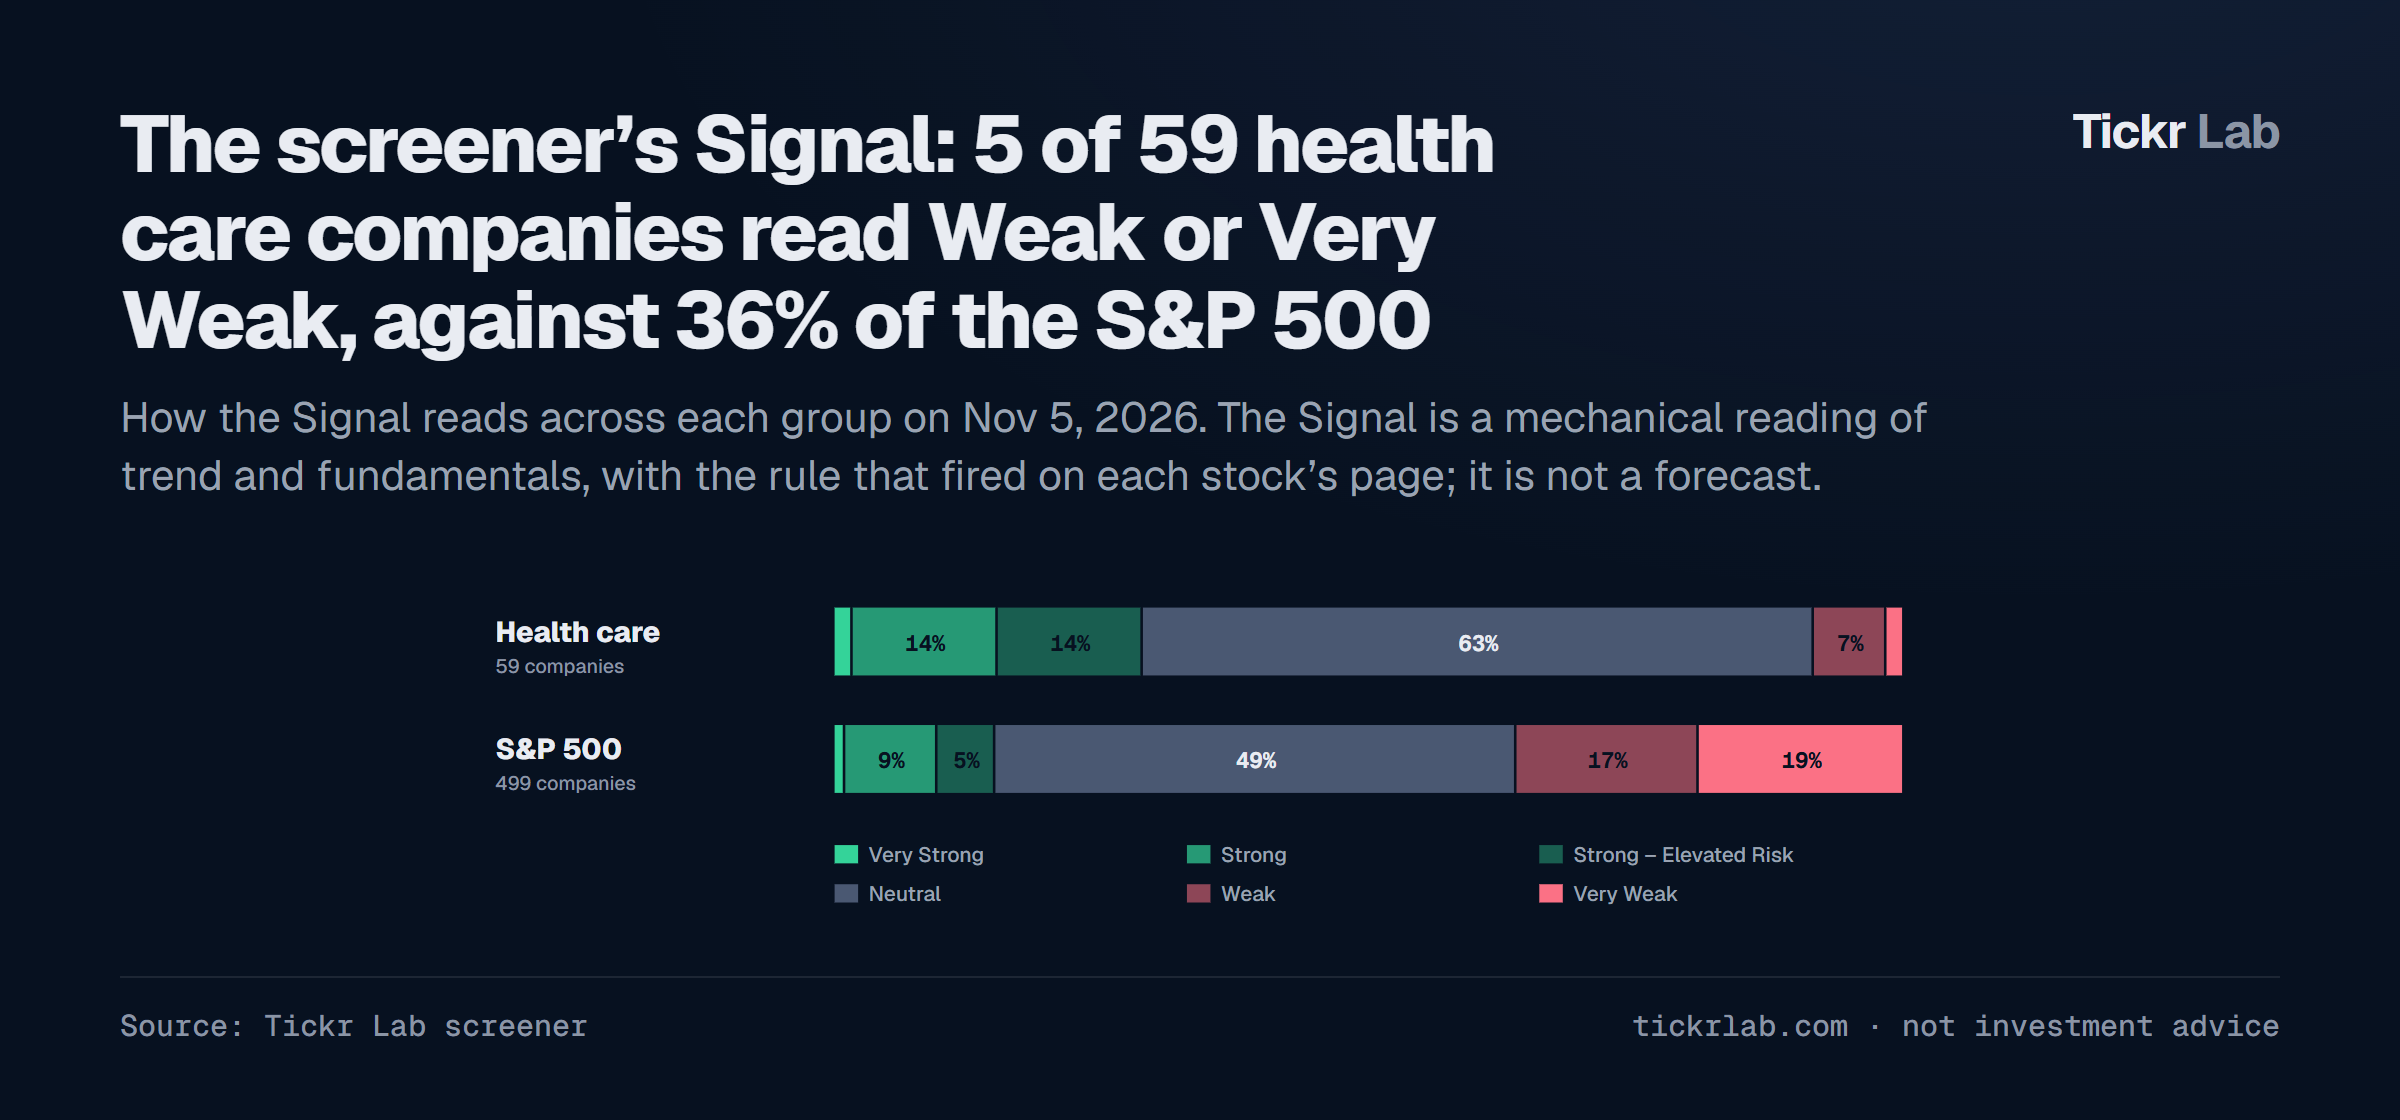
Value is market value. Off high is the distance from the 52-week high. Revenue and EPS are growth over the last four reported quarters against the same four a year before, from the results releases; EPS is the company’s own adjusted figure. Merck’s and Gilead’s adjusted figures include the charges for drugs bought in development, which is why theirs fell. The Signal is the screener’s mechanical reading, with the rule that fired.
What this is, and is not
A record of where the sector stands, measured the way the screener measures every stock. Prices leave out dividends. The sector figures use today’s S&P 500 members, so companies that have since left the index are not in the history. None of it says what comes next. Every company here has its own page on the screener.