Fire and life safety, the way a private equity buyer sees it
Why private equity keeps acquiring fire protection companies: inspections the law requires, thousands of small local firms, and prices that rise with size. The economics, the deals since 2021, what a buyer checks in a small private company, the risks, and how the listed companies are valued.
Fire and life safety looks like one of the dullest corners of the economy: sprinklers, alarm panels, extinguishers, a technician with a clipboard. To private equity it has been one of the busiest. Since 2024, Carrier has sold two fire businesses to private equity, a sovereign wealth fund pair took stakes in the most active acquirer in the industry, MSA Safety bought one of the carved-out pieces back from private equity at about 17 times its earnings before interest, tax, depreciation and amortization (EBITDA), and ADT agreed to be taken private at a $15.3 billion enterprise value. Underneath those headlines sit hundreds of small transactions a year: family-owned inspection and service companies with a few million dollars of revenue joining larger groups.
This post sets out why, from the point of view of a buyer looking at a smaller, privately held company: what the business is, where the money comes from, what it sells for and why size changes the price, how the large platforms were built, what a buyer checks before signing, and what can go wrong. It closes with how the listed companies in the field are valued today, since they are the yardstick every private valuation is eventually measured against.
What the industry is
Fire and life safety covers everything that detects a fire, warns the people in a building, suppresses the fire or helps them get out, plus the work of keeping all of it certified. It splits into a handful of trades:
- Detection and alarm: smoke and heat detectors, control panels, notification devices, and the communicators that send a signal to a monitoring centre. Governed in the US by NFPA 72.
- Water-based suppression: sprinkler systems, standpipes and fire pumps. The largest installed base, governed by NFPA 13 for design and NFPA 25 for upkeep.
- Special hazards: clean-agent gas systems for server rooms and data centres, foam systems for fuel and chemicals, and wet-chemical systems over commercial kitchens (NFPA 17A and 96).
- Portable equipment: extinguishers (NFPA 10), emergency lighting and signage.
- Monitoring: the central stations that watch alarm signals around the clock, billed monthly.
- Adjacent security work: access control, video and intrusion alarms, often sold by the same companies to the same building owners.
The value chain runs from manufacturers (Kidde Global Solutions, Johnson Controls with its Tyco and SimplexGrinnell brands, Honeywell, Napco Security, MSA Safety) through distributors to the contractors who design, install, inspect and repair systems in individual buildings. Above them all sits the "authority having jurisdiction": the local fire marshal or building department that enforces the code, plus the insurers who set their own requirements.
Private equity's interest is concentrated in that contractor layer. Manufacturing is consolidated and capital-hungry; contracting is local, fragmented and, crucially, recurring.
How big is it? Estimates differ by definition more than by disagreement. One research firm puts US fire and life safety services at about $32.5 billion of revenue in 2024; another puts the US fire protection systems market, equipment included, at about $21 billion in 2025, growing a little over 7% a year to 2030. A global study puts inspection, testing, repair and maintenance at more than half of all fire and life safety services revenue. Treat the totals as orders of magnitude; the shape matters more than the number.
Why the revenue recurs
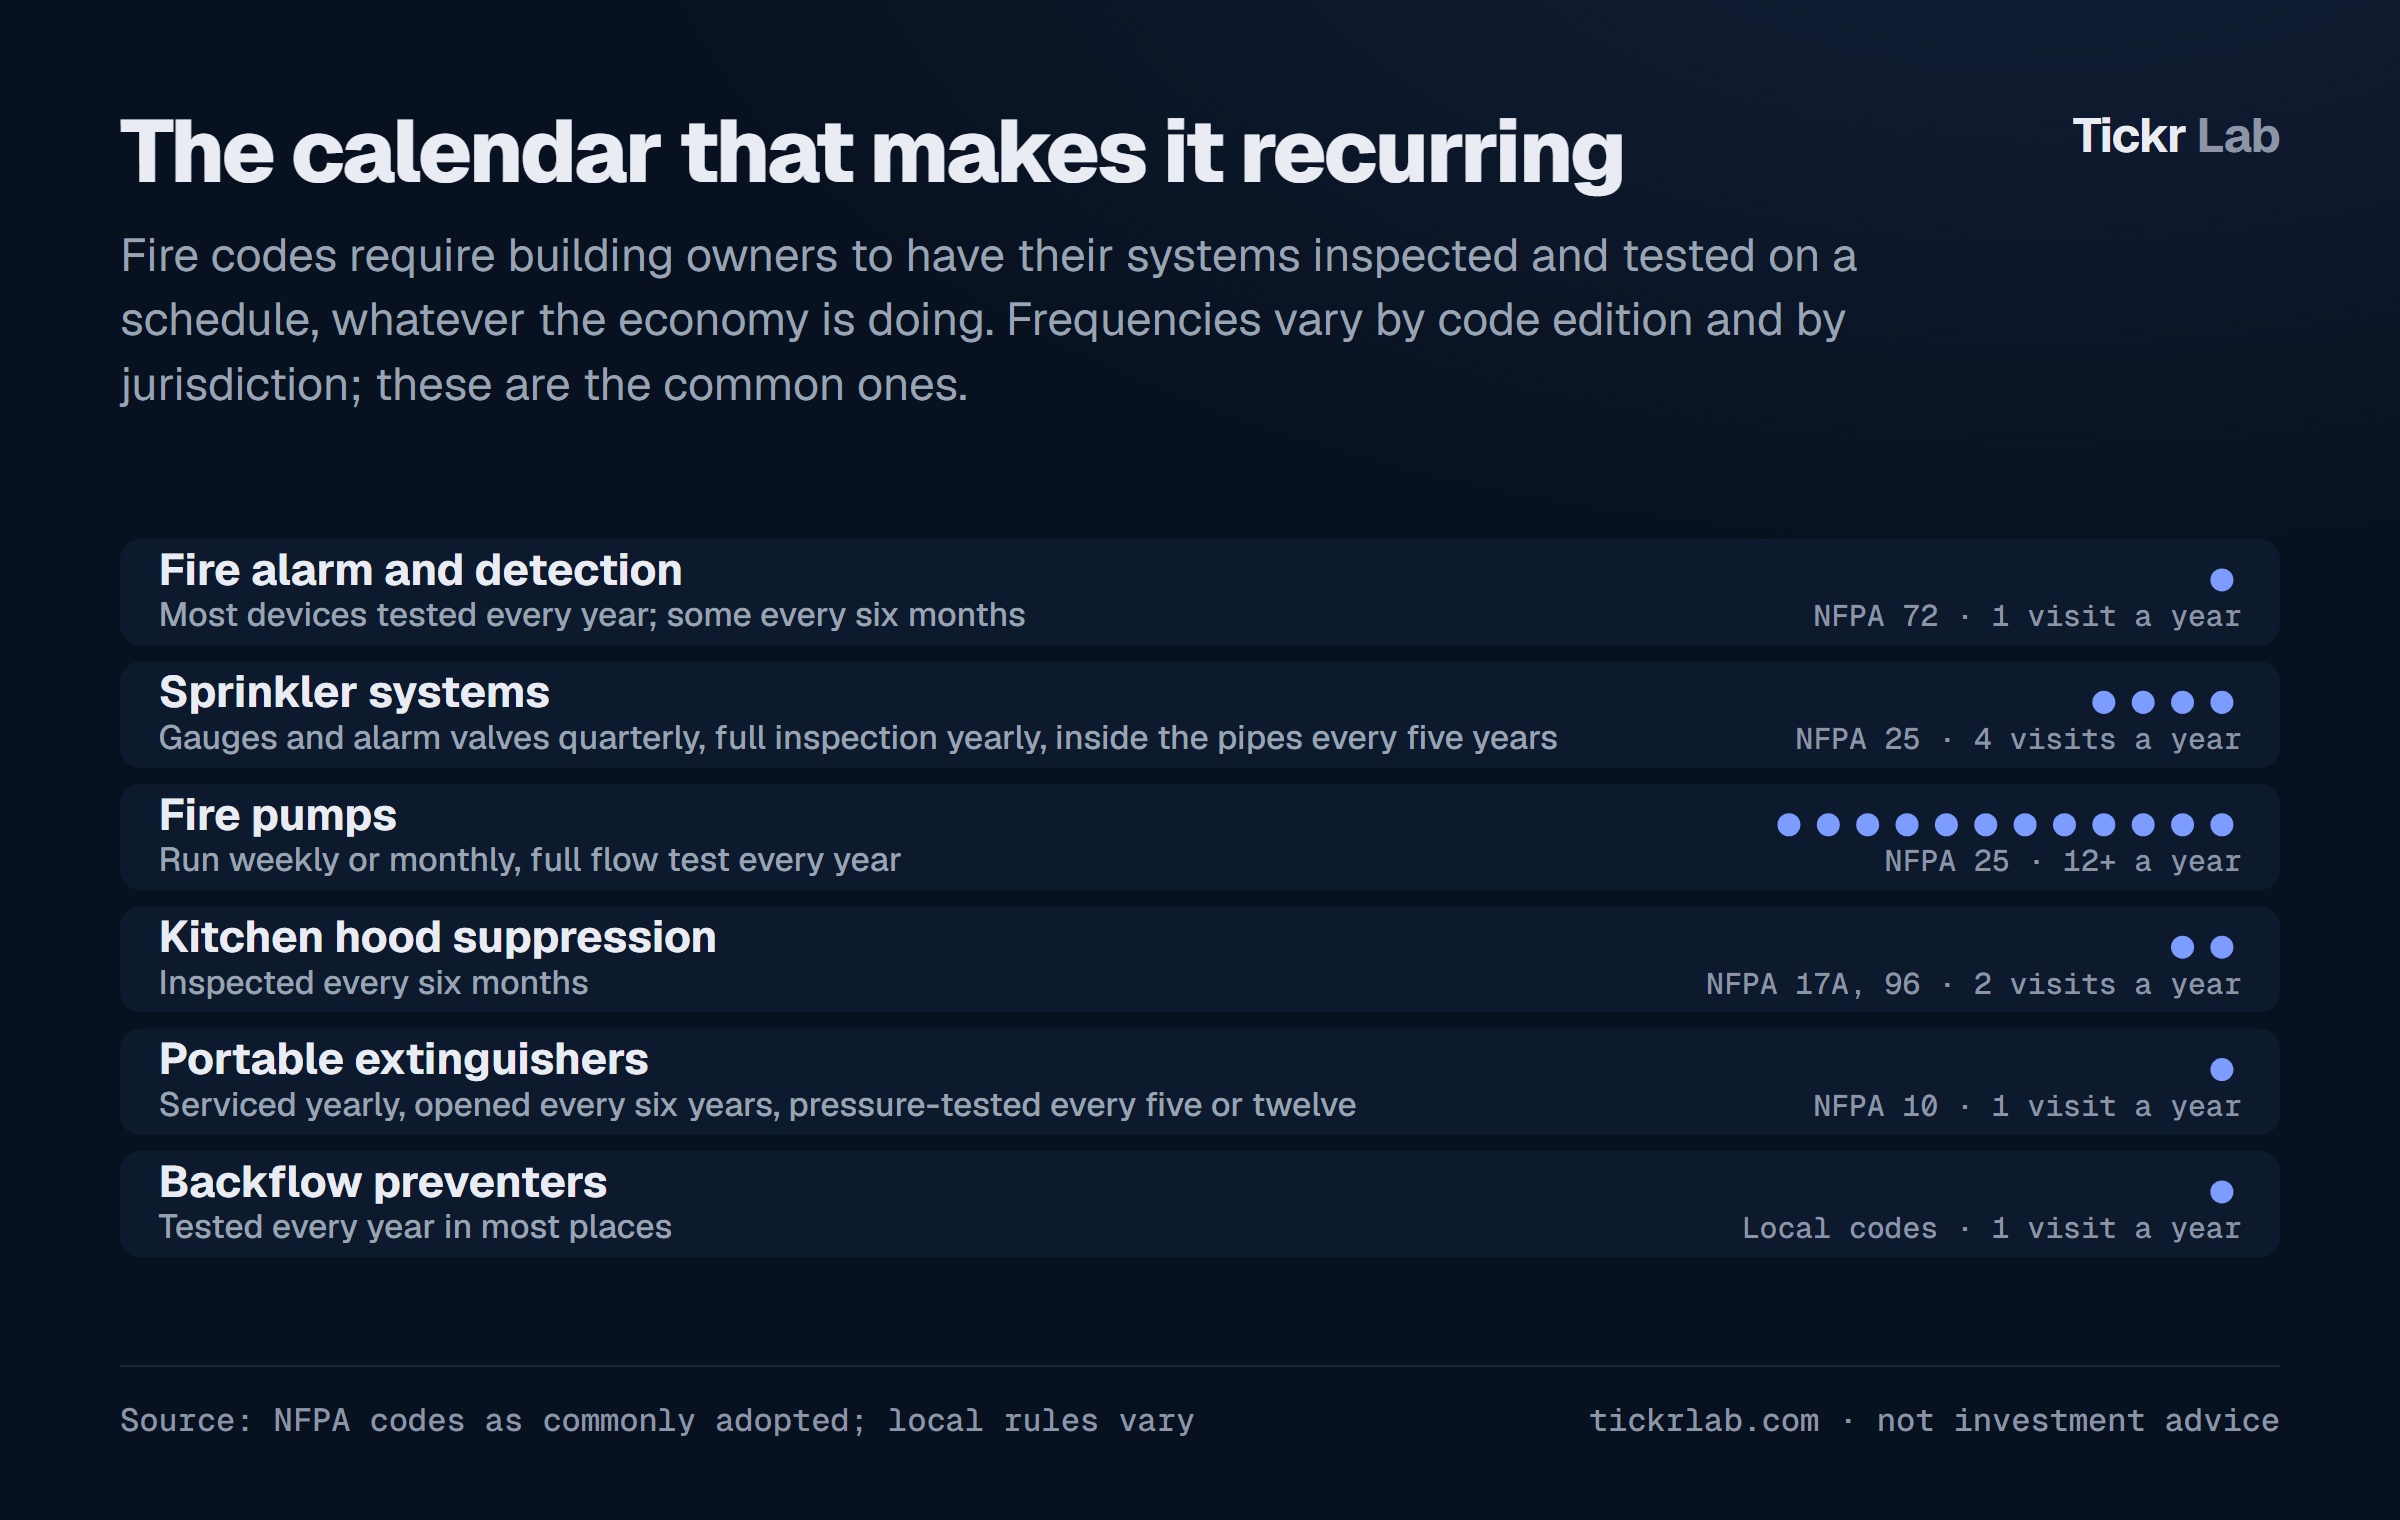
The core of the case is that a building owner cannot choose not to buy the service. Codes adopted by states and cities require systems to be inspected and tested on a schedule; the fire marshal can cite the owner, the insurer can decline cover, and a failed inspection can stop a tenant moving in. The schedule does not change with interest rates or the construction cycle. A typical commercial building with alarms, sprinklers, a fire pump, a kitchen and extinguishers generates something on the order of a dozen required visits a year, every year, for the life of the building.
That produces three kinds of revenue, and a buyer values them very differently:
- Inspection, testing and monitoring: contracted, mostly annual and renewing, priced per building or per device. Low ticket, high repeat, high margin once a route is dense.
- Service and repair: every inspection produces a list of deficiencies (a failed detector, a corroded sprinkler head, an expired extinguisher), and the inspector's company is usually first in line to quote the fix. This "pull-through" is where much of the profit is.
- Installation projects: new systems in new or renovated buildings, won by bid, lumpy, exposed to construction activity and usually the lowest margin of the three.
The industry's best-known public example of steering towards the first two is APi Group. Its "inspection first" strategy is explicit: win the inspection contract, then the service work, then the upgrade projects. It set itself the "13/60/80" targets: a 13% adjusted EBITDA margin, 60% of revenue from inspection, service and monitoring, and about 80% of adjusted EBITDA converted into free cash flow. It ended 2025 with a 13.2% margin and 80% conversion, with service at about 53% of the mix, and has since set new targets for 2028: more than $10 billion of revenue, a margin of 16% or more, and 60% or more from inspection, service and monitoring. Its Safety Services segment brought in $5.46 billion in 2025, up 13.7%, and was 65% of revenue in July to September 2026, by the segments APi reports to the SEC.
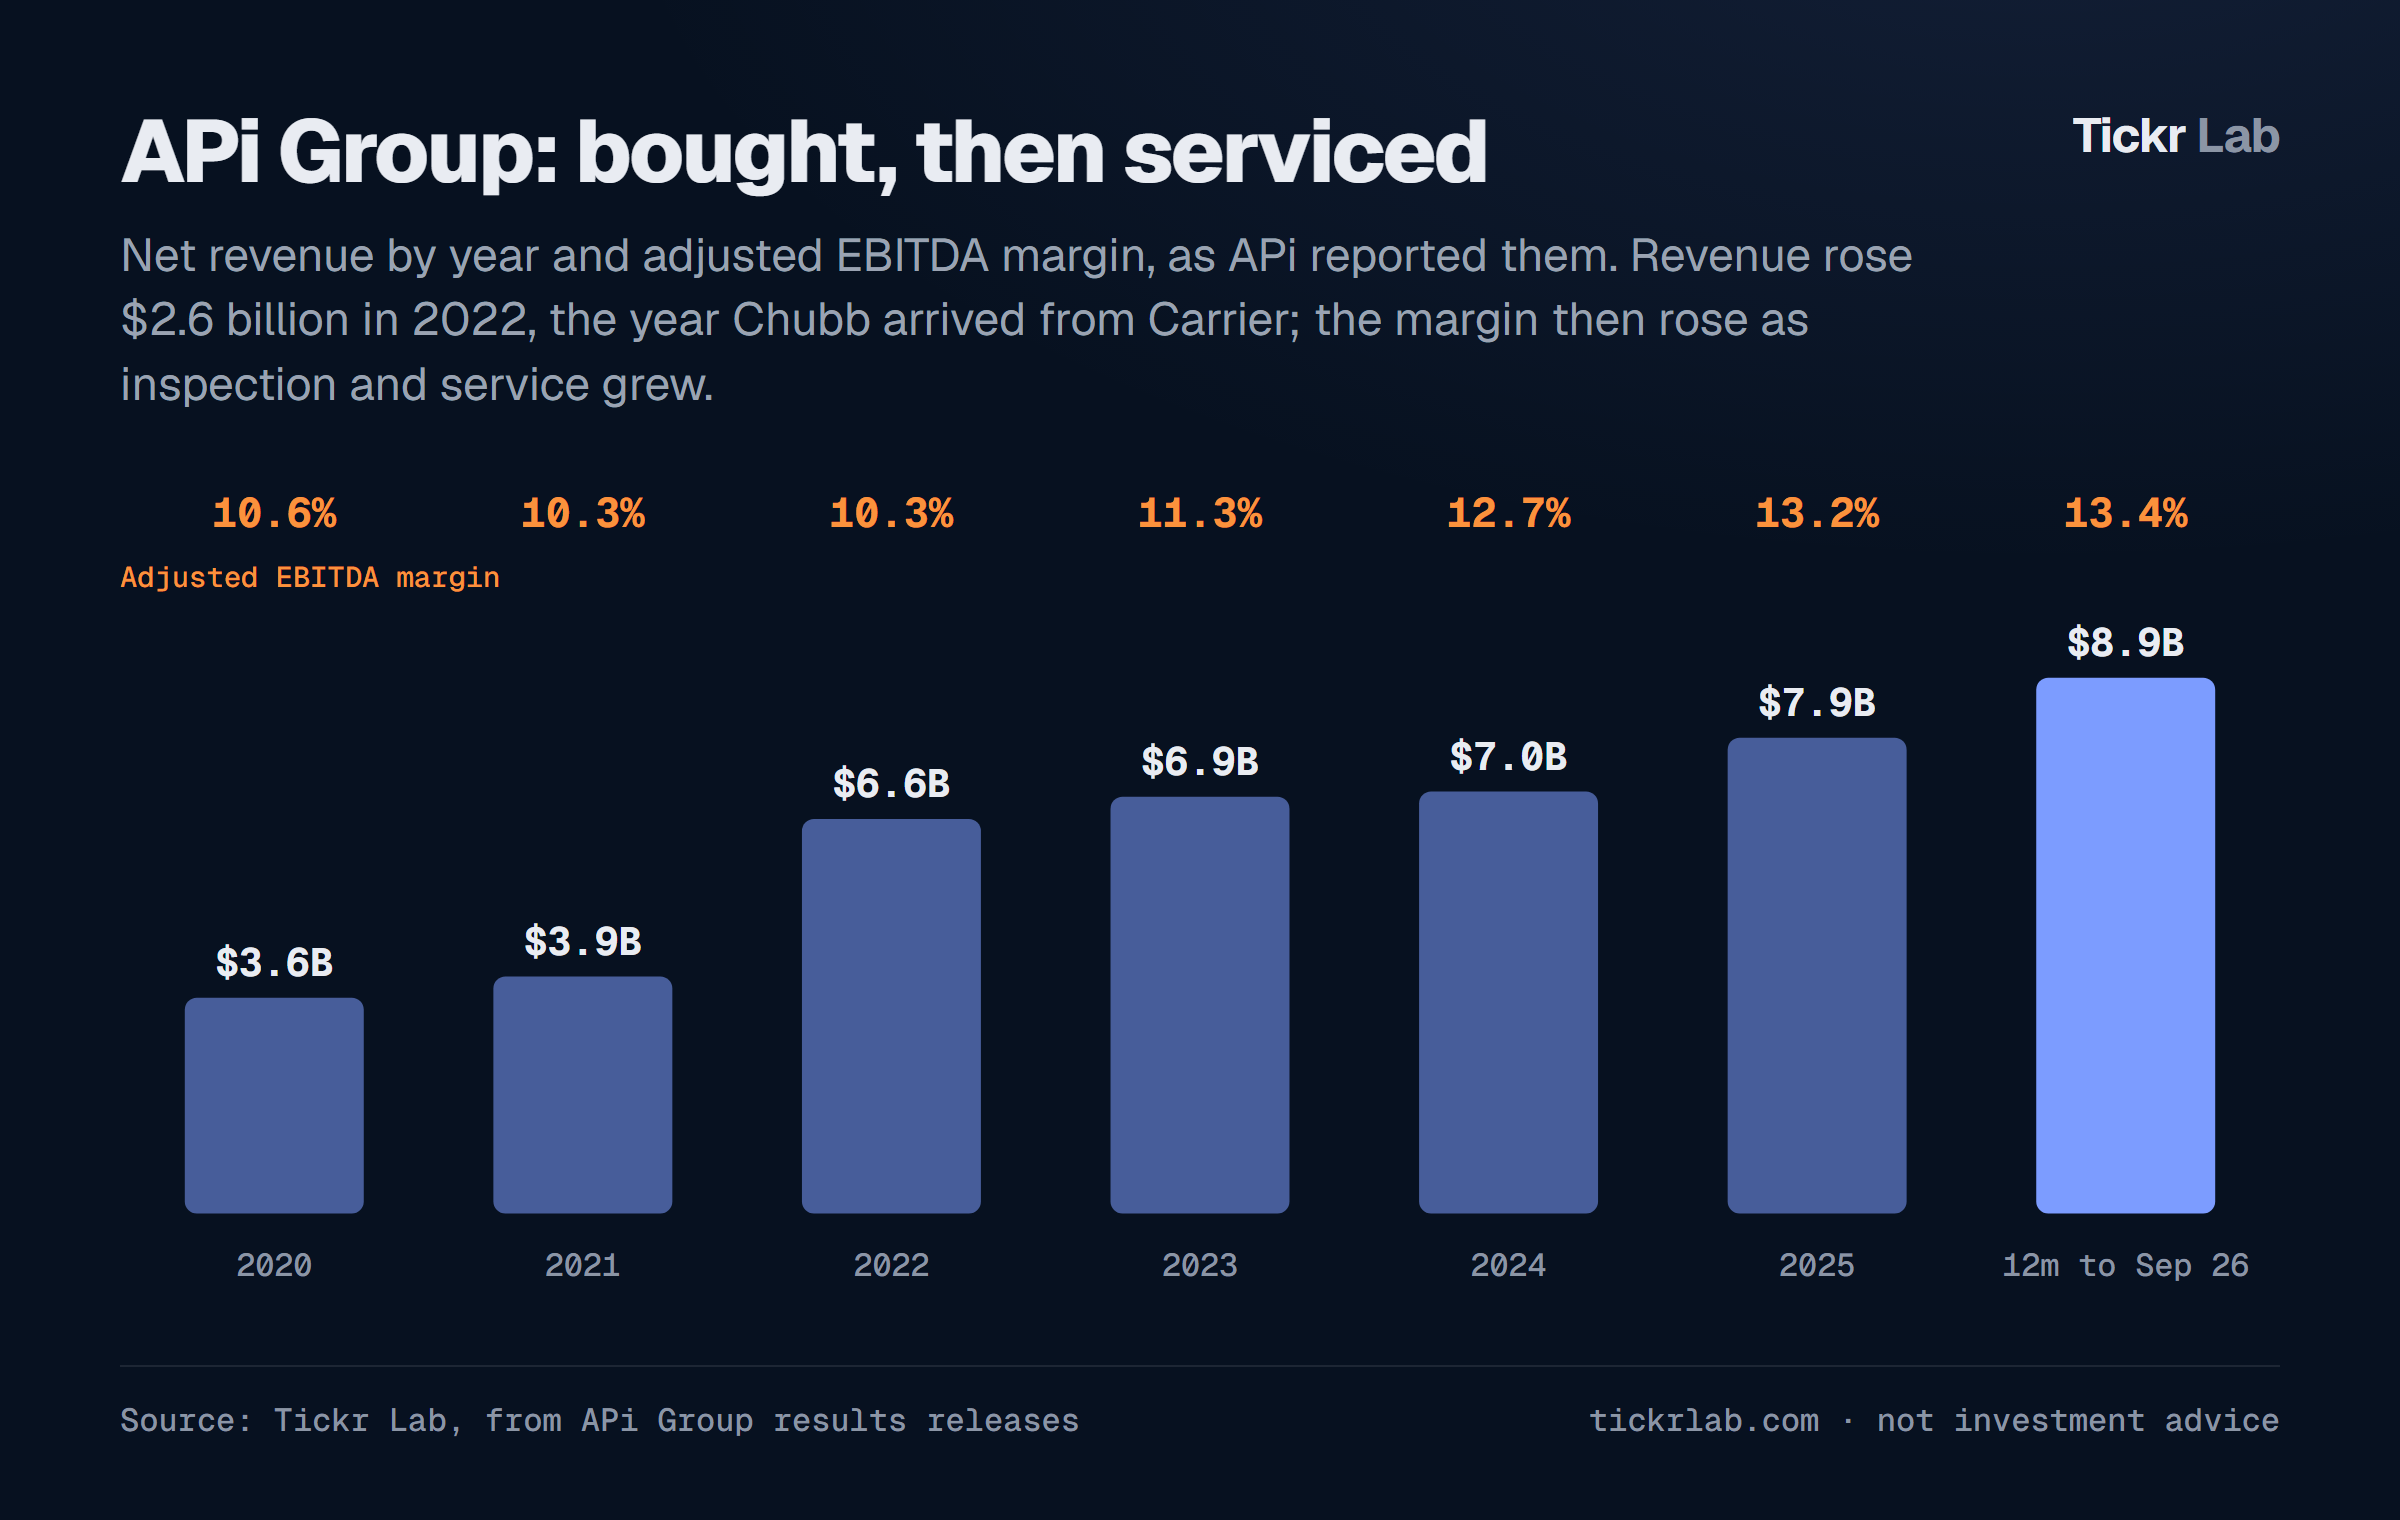
APi's own releases show the two halves of the model in sequence. Revenue jumped by $2.6 billion in 2022, the year it bought Chubb, while the adjusted EBITDA margin stayed at 10.3%. Over the next three years revenue grew more slowly and the margin rose every year, to 13.2% in 2025, as the service share grew. In the twelve months to September 2026 APi reported $8.9 billion of revenue and $1.19 billion of adjusted EBITDA, a 13.4% margin.
The smallest listed company in the field shows the same economics at a different scale. In the quarter to September 2026, Napco Security reported recurring service revenue (fees for the radio communicators that send alarm signals) up 11.5% to a record $26.1 million, more than half of its $50.0 million of revenue, while its equipment sales fell 7.3%. Its gross margin was 58.7%, and it reported adjusted EBITDA of $15.5 million, a 31.0% margin, saying its recurring service revenue carries gross margins above 90%. Recurring revenue is what kept the quarter growing when product sales did not.
What a fire business is worth, and why size changes it
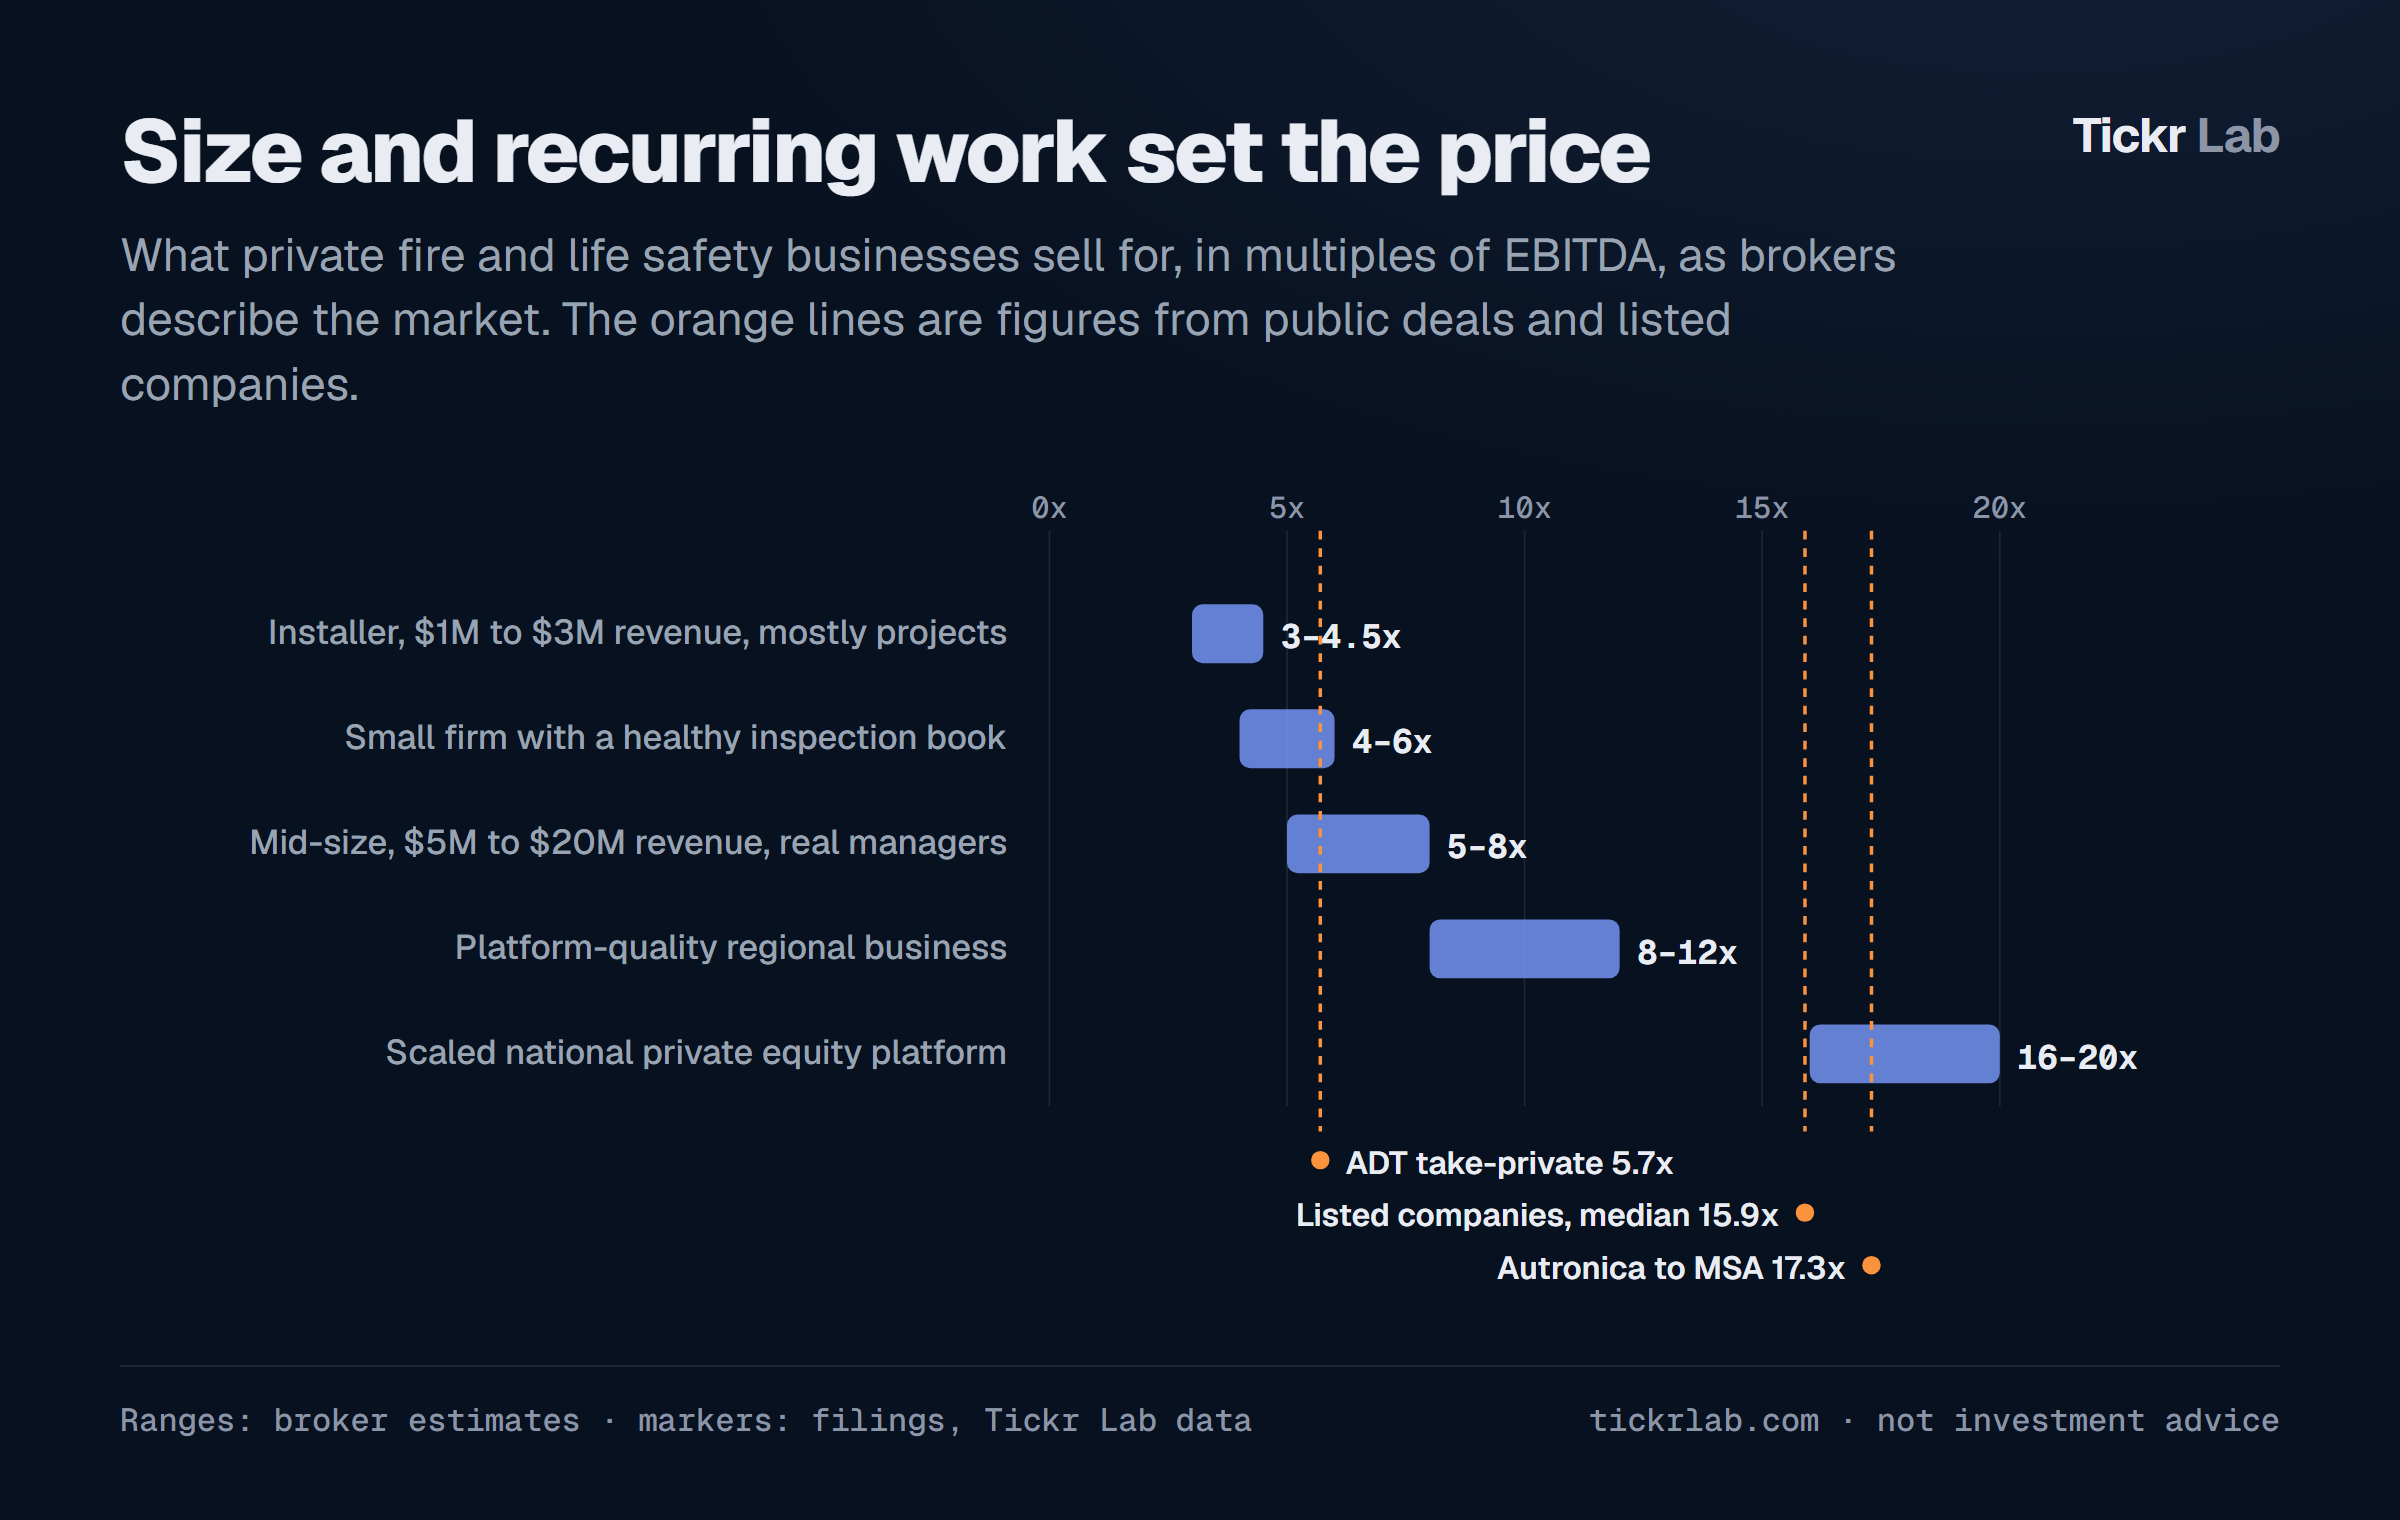
Brokers who sell fire companies describe a consistent ladder. These are their estimates, not audited figures, and every deal differs, but the pattern is what matters:
- A small installer with $1 million to $3 million of revenue and little recurring work: roughly 3 to 4.5 times EBITDA.
- A small firm with a healthy inspection book: about 4 to 6 times. One broker puts the step-up at the point where inspection and monitoring pass roughly 40% of revenue.
- A mid-size operator, $5 million to $20 million of revenue, with managers who are not the owner: about 5 to 8 times.
- A regional business good enough to be a platform for further acquisitions: 8 to 12 times or more.
- A scaled national platform: 16 to 20 times, the range brokers and PE Hub's reporting cite for the largest private equity-backed groups.
Two public data points sit on the same scale. MSA Safety paid about $555 million for Autronica, a Norwegian maker of fire and gas detection, which had about $160 million of sales in 2025 at an adjusted EBITDA margin of about 20%: about 17 times EBITDA, from the figures MSA gave. And ADT's agreed price implies about 5.7 times the $2.68 billion of adjusted EBITDA it reported for the four quarters to September. ADT is a different business: mostly residential monitoring, where winning each subscriber costs a great deal of up-front money, so its EBITDA overstates the cash it keeps.
The gap between the bottom and the top of the ladder is the central fact of the industry's deal-making. A platform that pays 5 or 6 times for a local inspection company and adds its EBITDA to a group that is itself valued at 15 times or more creates value on paper the day the deal closes, before any improvement. Buyers call it multiple arbitrage. It is why so many private equity firms run the same playbook here, and also why the playbook's results depend on that gap staying open.
How the platforms were built
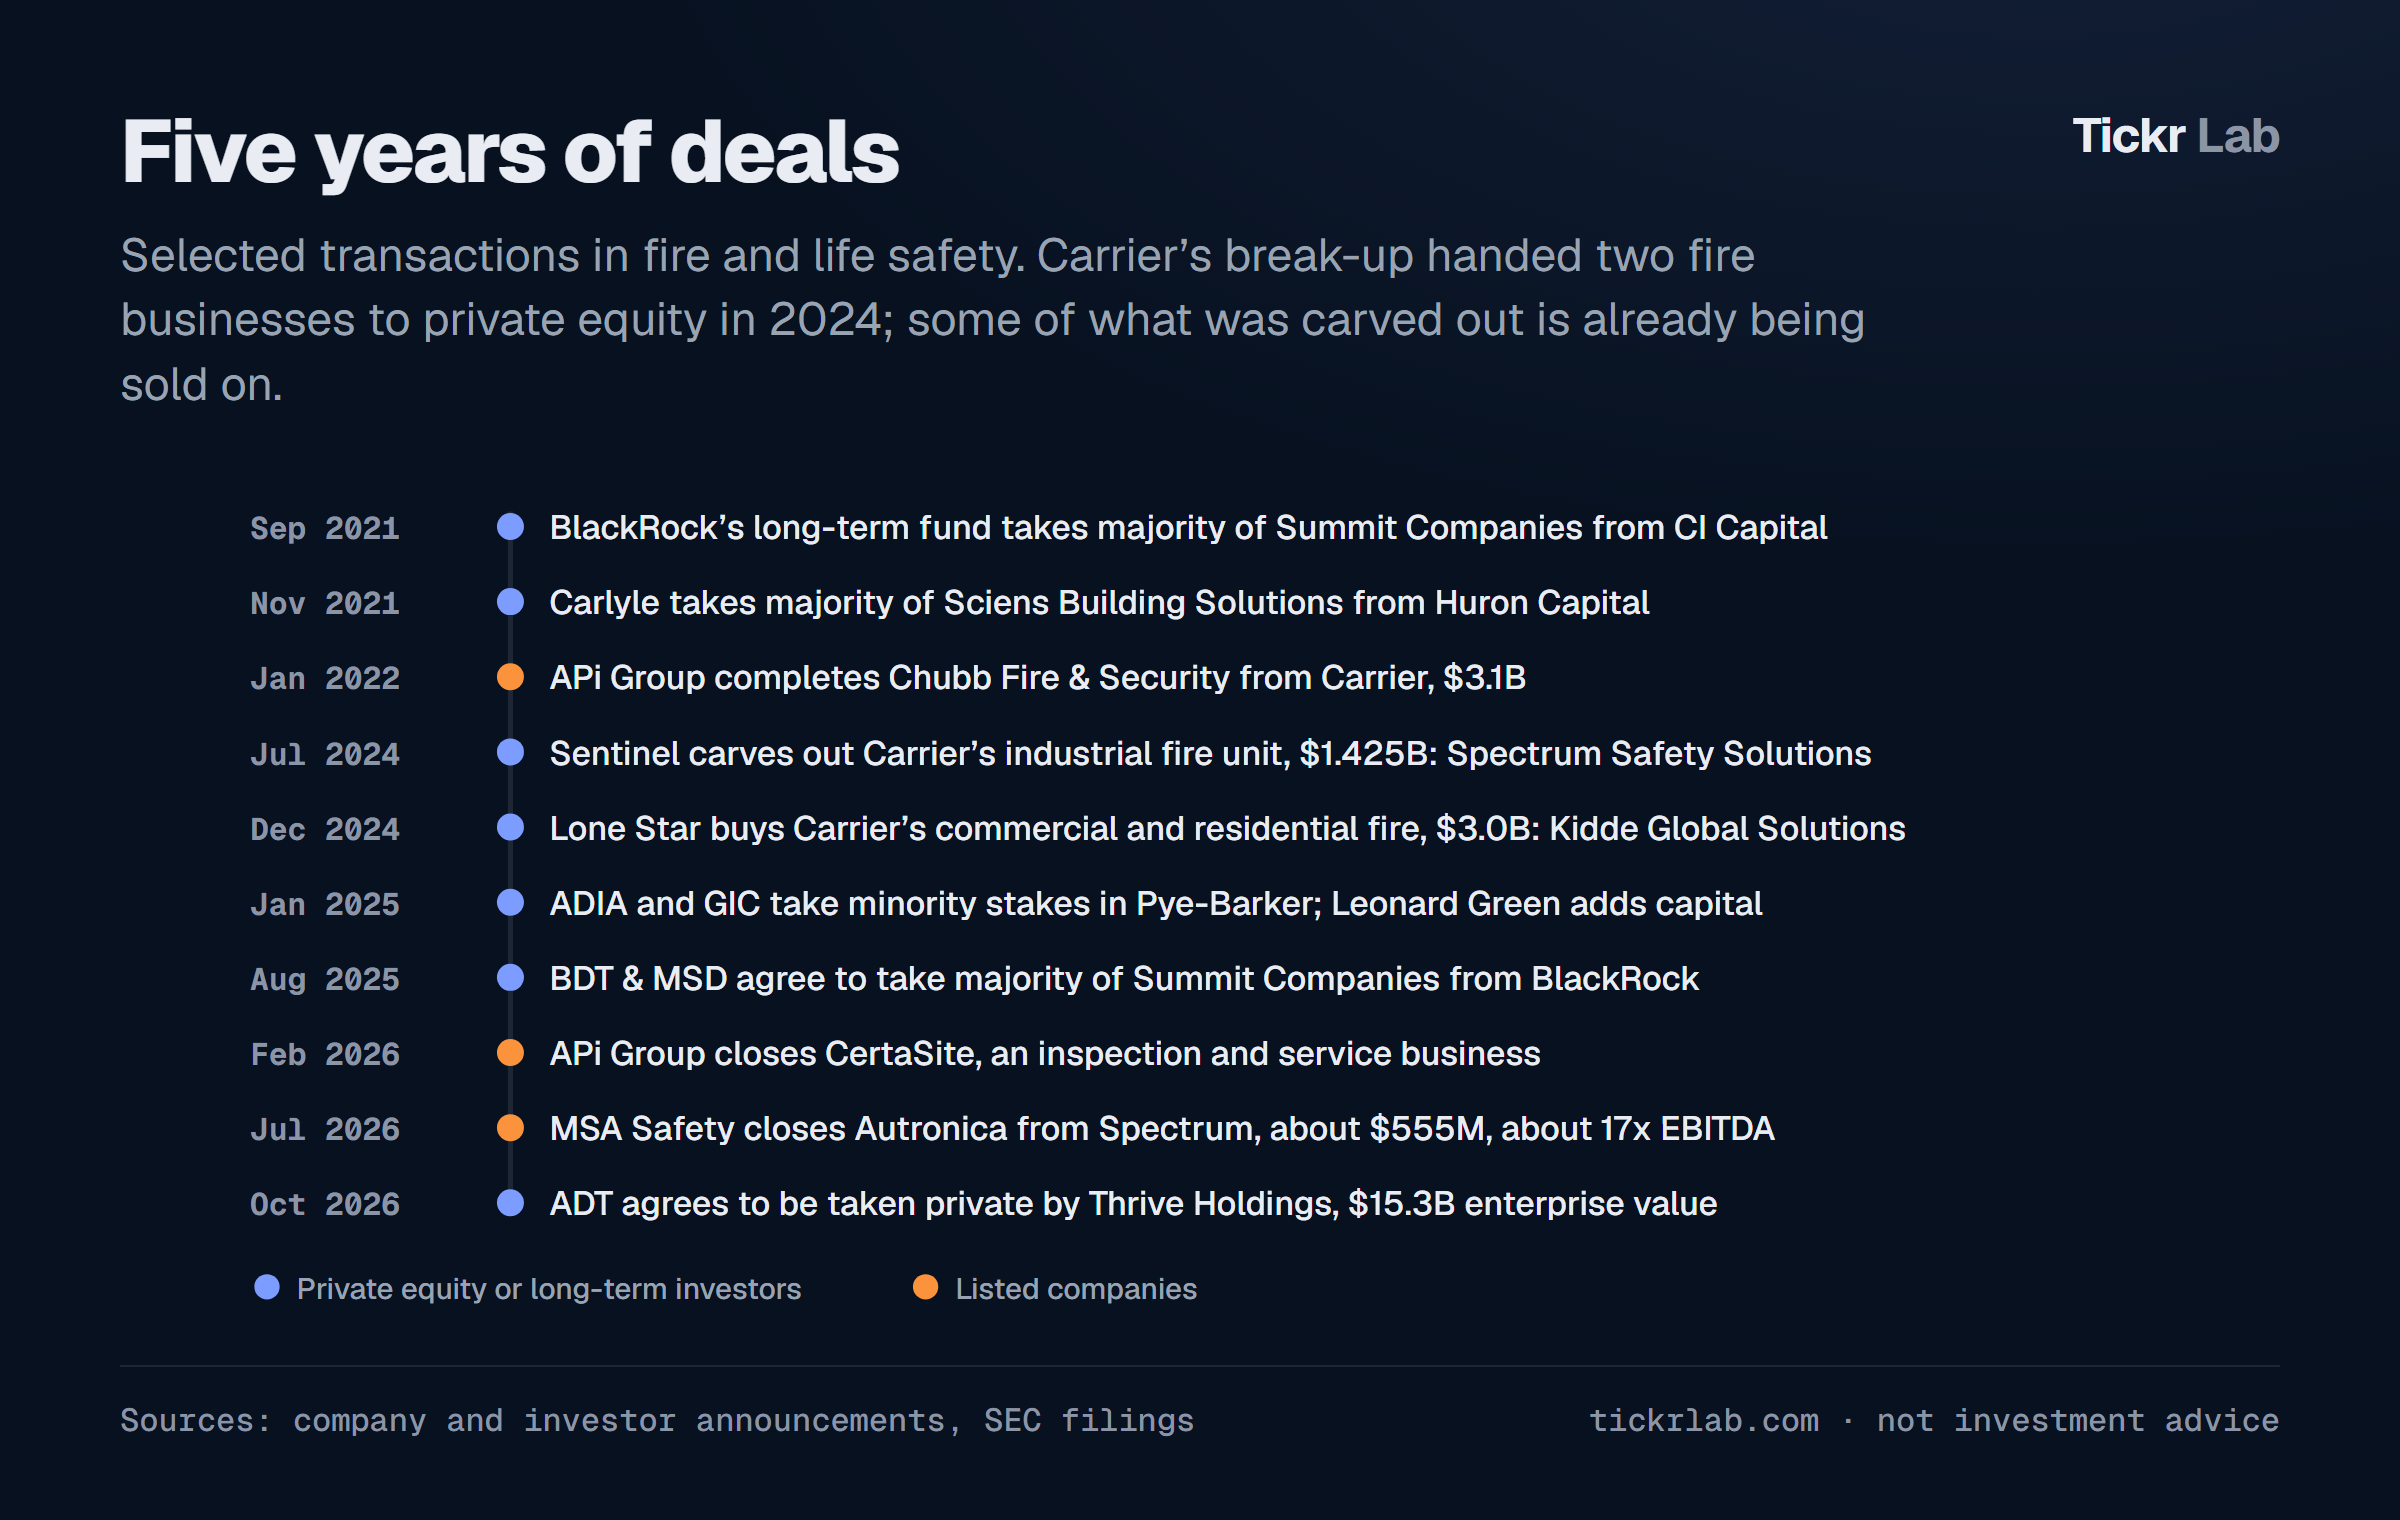
Three private platforms illustrate the model.
Pye-Barker Fire & Safety, based near Atlanta, is the most acquisitive. Altas Partners holds the majority, Leonard Green is a large co-investor, and in January 2025 the Abu Dhabi Investment Authority and Singapore's GIC took minority stakes. CB Insights counts about 141 acquisitions to date; one industry tally puts 57 of them in 2025 alone. Its 2026 purchases have included Universal Fire Systems in Tampa, Jersey Fire Protection in New Jersey and ASCI Security in California. The rhythm is close to one acquisition a week.
Sciens Building Solutions shows the hand-off from one owner to the next. Huron Capital built it with 13 add-on acquisitions, then sold a majority to Carlyle in November 2021. Under Carlyle it has kept buying regional fire and security firms, including its ninth Florida acquisition in March 2026.
Summit Companies has now been through three owners. CI Capital Partners sold it to BlackRock's long-term private capital fund in 2021, and in August 2025 BDT & MSD Partners agreed to take a majority from BlackRock, with the founder and management staying on as shareholders. Each owner took on a bigger business than the last; the prices were not disclosed.
The largest supply of assets came from a corporate break-up. In 2024 Carrier sold its security business, Global Access Solutions, to Honeywell for $4.95 billion; its industrial fire unit (Det-Tronics, Marioff, Autronica, Fireye) to Sentinel Capital Partners for $1.425 billion, which named it Spectrum Safety Solutions; and its commercial and residential fire business (Kidde, Edwards, GST, Badger, Gloria, Aritech) to Lone Star Funds for $3.0 billion as Kidde Global Solutions. Two years later Sentinel sold Autronica on to MSA. That is the full private equity cycle in miniature: a corporate carve-out at a conglomerate's discount, a period as a standalone company, a sale of a piece to a strategic buyer that wanted it more.
Listed companies buy too. APi Group bought Chubb Fire & Security from Carrier for $3.1 billion in January 2022, and in February 2026 closed CertaSite, an inspection and service business it said moves it towards its 60% service target. In its July to September 2026 quarter APi reported revenue of $2.55 billion, up 22.5% (15.7% organic, the rest from acquisitions), adjusted EBITDA of $350 million, and raised its full-year revenue outlook to $9.20 billion to $9.25 billion.
One broker count puts the industry's deals at 125 in the third quarter of 2025, up two thirds on a year earlier, with private equity add-ons close to half of them. The figure comes from a firm that sells these companies, so treat it as a sign of direction rather than a census.
What a buyer looks for in a small private company
For a private equity buyer, a fire company with $3 million to $30 million of revenue is usually an add-on to an existing platform rather than a standalone investment. The questions that set the price are mostly about how predictable the revenue is and how much of the company walks out of the door with the owner.
The revenue book
- What share of revenue is inspection, testing and monitoring, contracted and renewing? What share is service and repair, and what share is project work?
- How many inspection contracts are there, how long have customers stayed, and do contracts renew automatically?
- What is the deficiency pull-through: how much repair work does each dollar of inspection generate, and how much of the quoted repair work is won?
- Who are the customers? Property managers, schools, hospitals, restaurant chains and industrial sites behave differently. Does any one customer or general contractor account for more than a tenth of revenue?
- For project work: how good is the backlog, how are bids priced, and how often do jobs overrun?
People and licences
- How many technicians, how many NICET-certified and at what level, how old are they, and how many left last year? NICET certification (four levels, in alarm, sprinkler and special-hazard work) is required or preferred in many jurisdictions and takes years to earn.
- Who holds the state and local licences? In many places the licence is held by a named individual (a "qualifier") rather than the company. If that person is the owner who is selling, licence continuity has to be planned before closing.
- How dependent are customer relationships on the owner personally? A business whose owner answers every call is worth less than one with service managers.
- Is the workforce unionized, and how are wages moving against prices?
Operations and quality of earnings
- Route density: how many inspections per technician per day, and how far apart are the customers? Density is the main source of margin improvement after an acquisition.
- Systems: is inspection work scheduled and documented in software, with reports a fire marshal accepts, or on paper?
- Pricing: when did prices last rise, and do contracts allow annual increases?
- Working capital: how long do customers take to pay, and how much is tied up in retentions on project work?
- Adjusted EBITDA: what is the owner paid, what personal costs run through the business, and what would a replacement general manager cost?
Liabilities
- Warranty and defective-work claims, and the insurance that covers them.
- Exposure to PFAS (the "forever chemicals" in legacy firefighting foam): has the company installed, serviced or disposed of foam systems, and how? Kidde-Fenwal, a former Carrier subsidiary that made foam, went into bankruptcy under litigation over it.
- Code violations or open citations on systems the company inspected.
Why buyers keep coming
- Non-discretionary demand. Inspections are required by law and insurers regardless of the economy, which supports lending against the cash flows.
- Fragmentation. Thousands of local firms, many founded a generation ago, with owners reaching retirement and no successor. That supplies a steady flow of add-on targets at the bottom of the multiple ladder.
- An expanding scope. Codes tend to tighten, buildings age and need upgrades, and new risks keep arriving. Data centres need clean-agent and early-warning systems, and lithium-ion batteries in energy storage and in data-centre backup power cannot be put out by gas alone, pushing operators towards hybrid designs. Market studies disagree widely on the size of these niches, but agree on the direction.
- A forced replacement cycle. Fluorine-based firefighting foams are being phased out. In the EU, portable extinguishers with PFAS foam cannot be placed on the market from October 2026. The US Defense Department's deadline for replacing such foam was extended to October 2026, and US states are adding their own rules. Systems must be drained, cleaned and refilled, because residues of old foam can make a new agent fail its tests. That is paid work for whoever services the system.
- Several exit routes. Sale to a larger private equity group (Summit, three times), sale to a strategic buyer (Autronica to MSA), or a listed company paying for the services model (APi's purchases).
What can go wrong
- Labour. The industry's constraint is technicians, not customers. NFPA's own survey says the skilled-labour shortage continues to weigh on budgets, and certification takes years. A platform that cannot hire or keep technicians cannot grow its inspection book, whatever it pays for companies.
- Entry prices. Multiple arbitrage works only while small companies still sell at low multiples and large platforms at high ones. With dozens of buyers chasing the same family firms, the bottom of the ladder has been rising, and the top depends on the next buyer's appetite and on interest rates.
- Integration. A group that buys a company a week has to merge pricing, software, licences, safety practices and cultures at the same pace. Roll-ups that skip the integration end up as a holding company of small firms with a big debt load.
- Leverage. Platforms are usually financed with substantial debt against recurring cash flows. Higher interest rates reduce the room for error, especially if growth slows.
- Project exposure. Firms with a large share of installation work are more cyclical than the "recurring" label suggests; new construction slowdowns reach them first.
- Liability. Life safety work carries a long tail of claims, and PFAS litigation has already taken one manufacturer into bankruptcy.
How the listed companies are valued
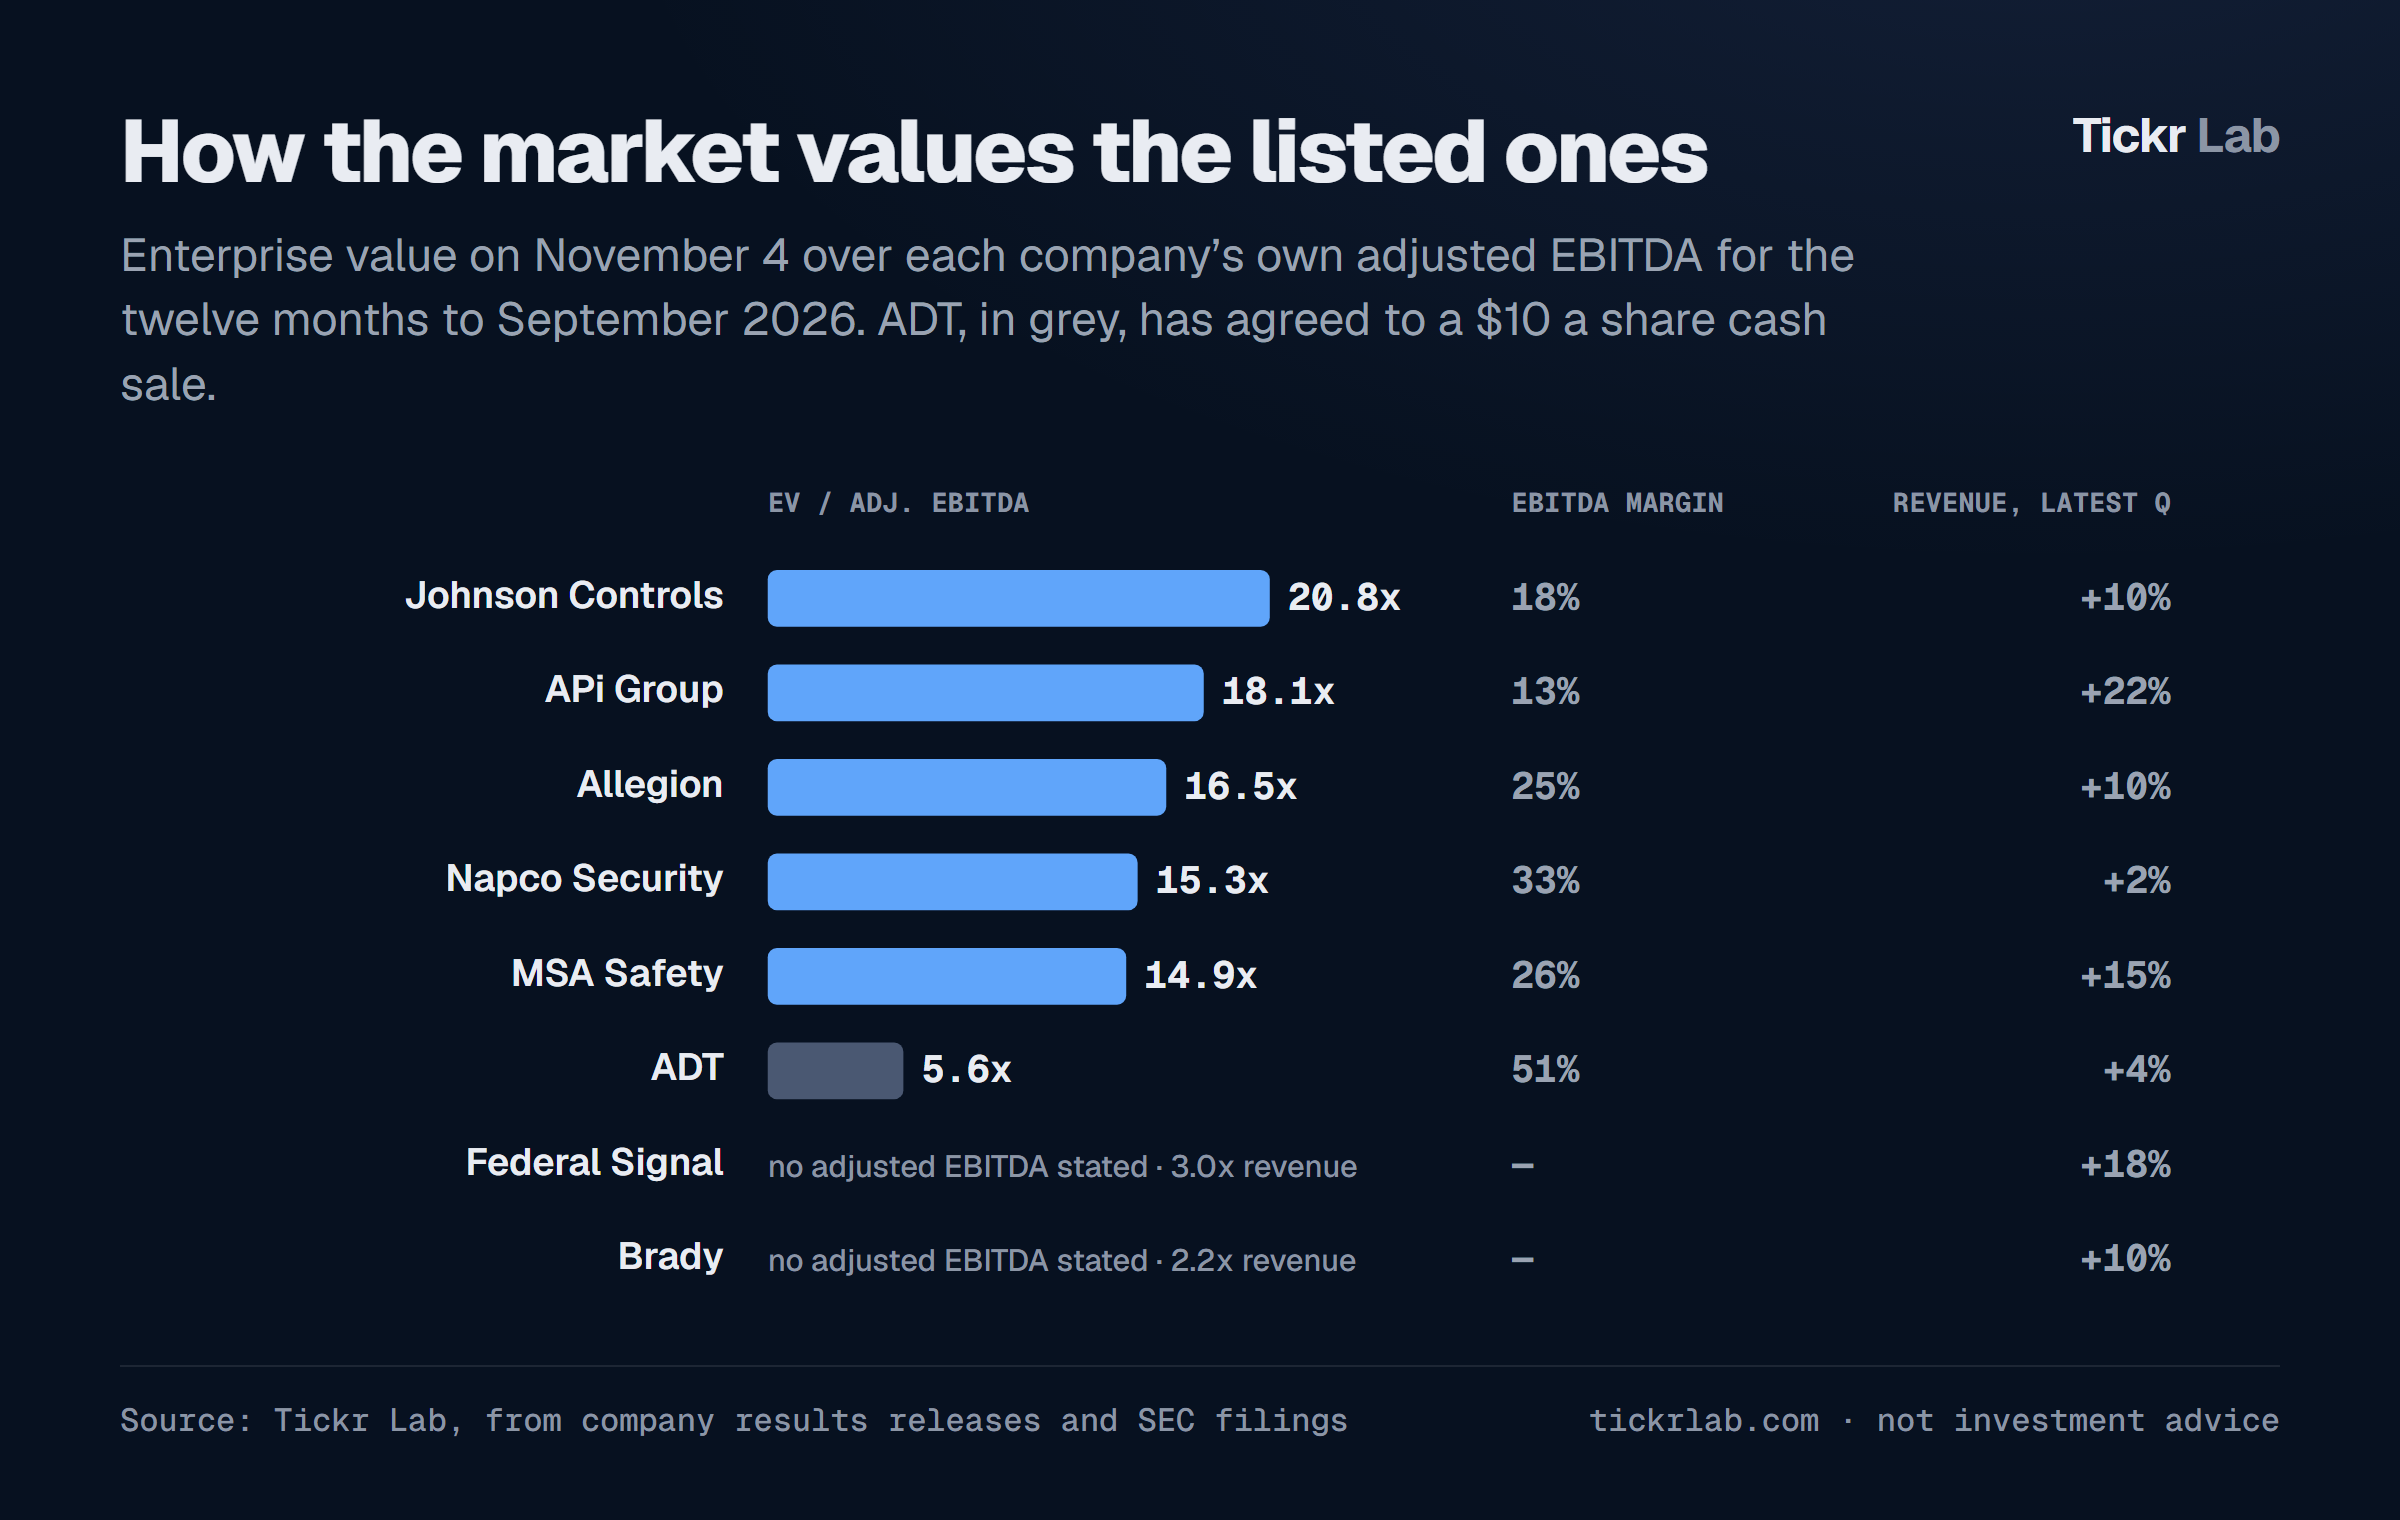
In this chart: Johnson Controls · APi Group · Allegion · Napco Security · MSA Safety · ADT · Federal Signal · Brady
The listed companies are where a private platform's eventual value is tested, by a sale to one of them or by comparison with them. Measured the way a buyer would measure a private company (enterprise value over the adjusted EBITDA each company itself reports, for the twelve months to September 2026), five of them were valued on November 4 at between 14.9 and 20.8 times. The median of the six that state the figure is about 16 times, the bottom of the brokers' range for national platforms. ADT, agreeing to a sale, is at 5.6 times.
- Johnson Controls, 20.8 times its $4.74 billion of adjusted EBITDA for its year to September, is the largest. Its Tyco fire suppression and SimplexGrinnell businesses sit inside a building technology group in which service is 31% of revenue.
- APi Group, 18.1 times, is the closest public match to the private platforms, with the lowest margin here (13%) and the fastest growth (revenue up 22% on a year earlier in July to September, 15.7% of it organic).
- Allegion, 16.5 times, makes locks and exit hardware, including the fire-rated doors and panic bars codes require.
- Napco Security, 15.3 times, has the highest margin (33%) but its revenue grew only 2% in the latest quarter, as equipment sales fell.
- MSA Safety, 14.9 times, counts Autronica only from July 9; on its own pro forma figure, which adds Autronica for the full period, its net debt is 1.7 times adjusted EBITDA.
- Federal Signal and Brady do not report an adjusted EBITDA. On revenue, Federal Signal is valued at 3.0 times and Brady at 2.2 times; Federal Signal also files no results releases with the SEC.
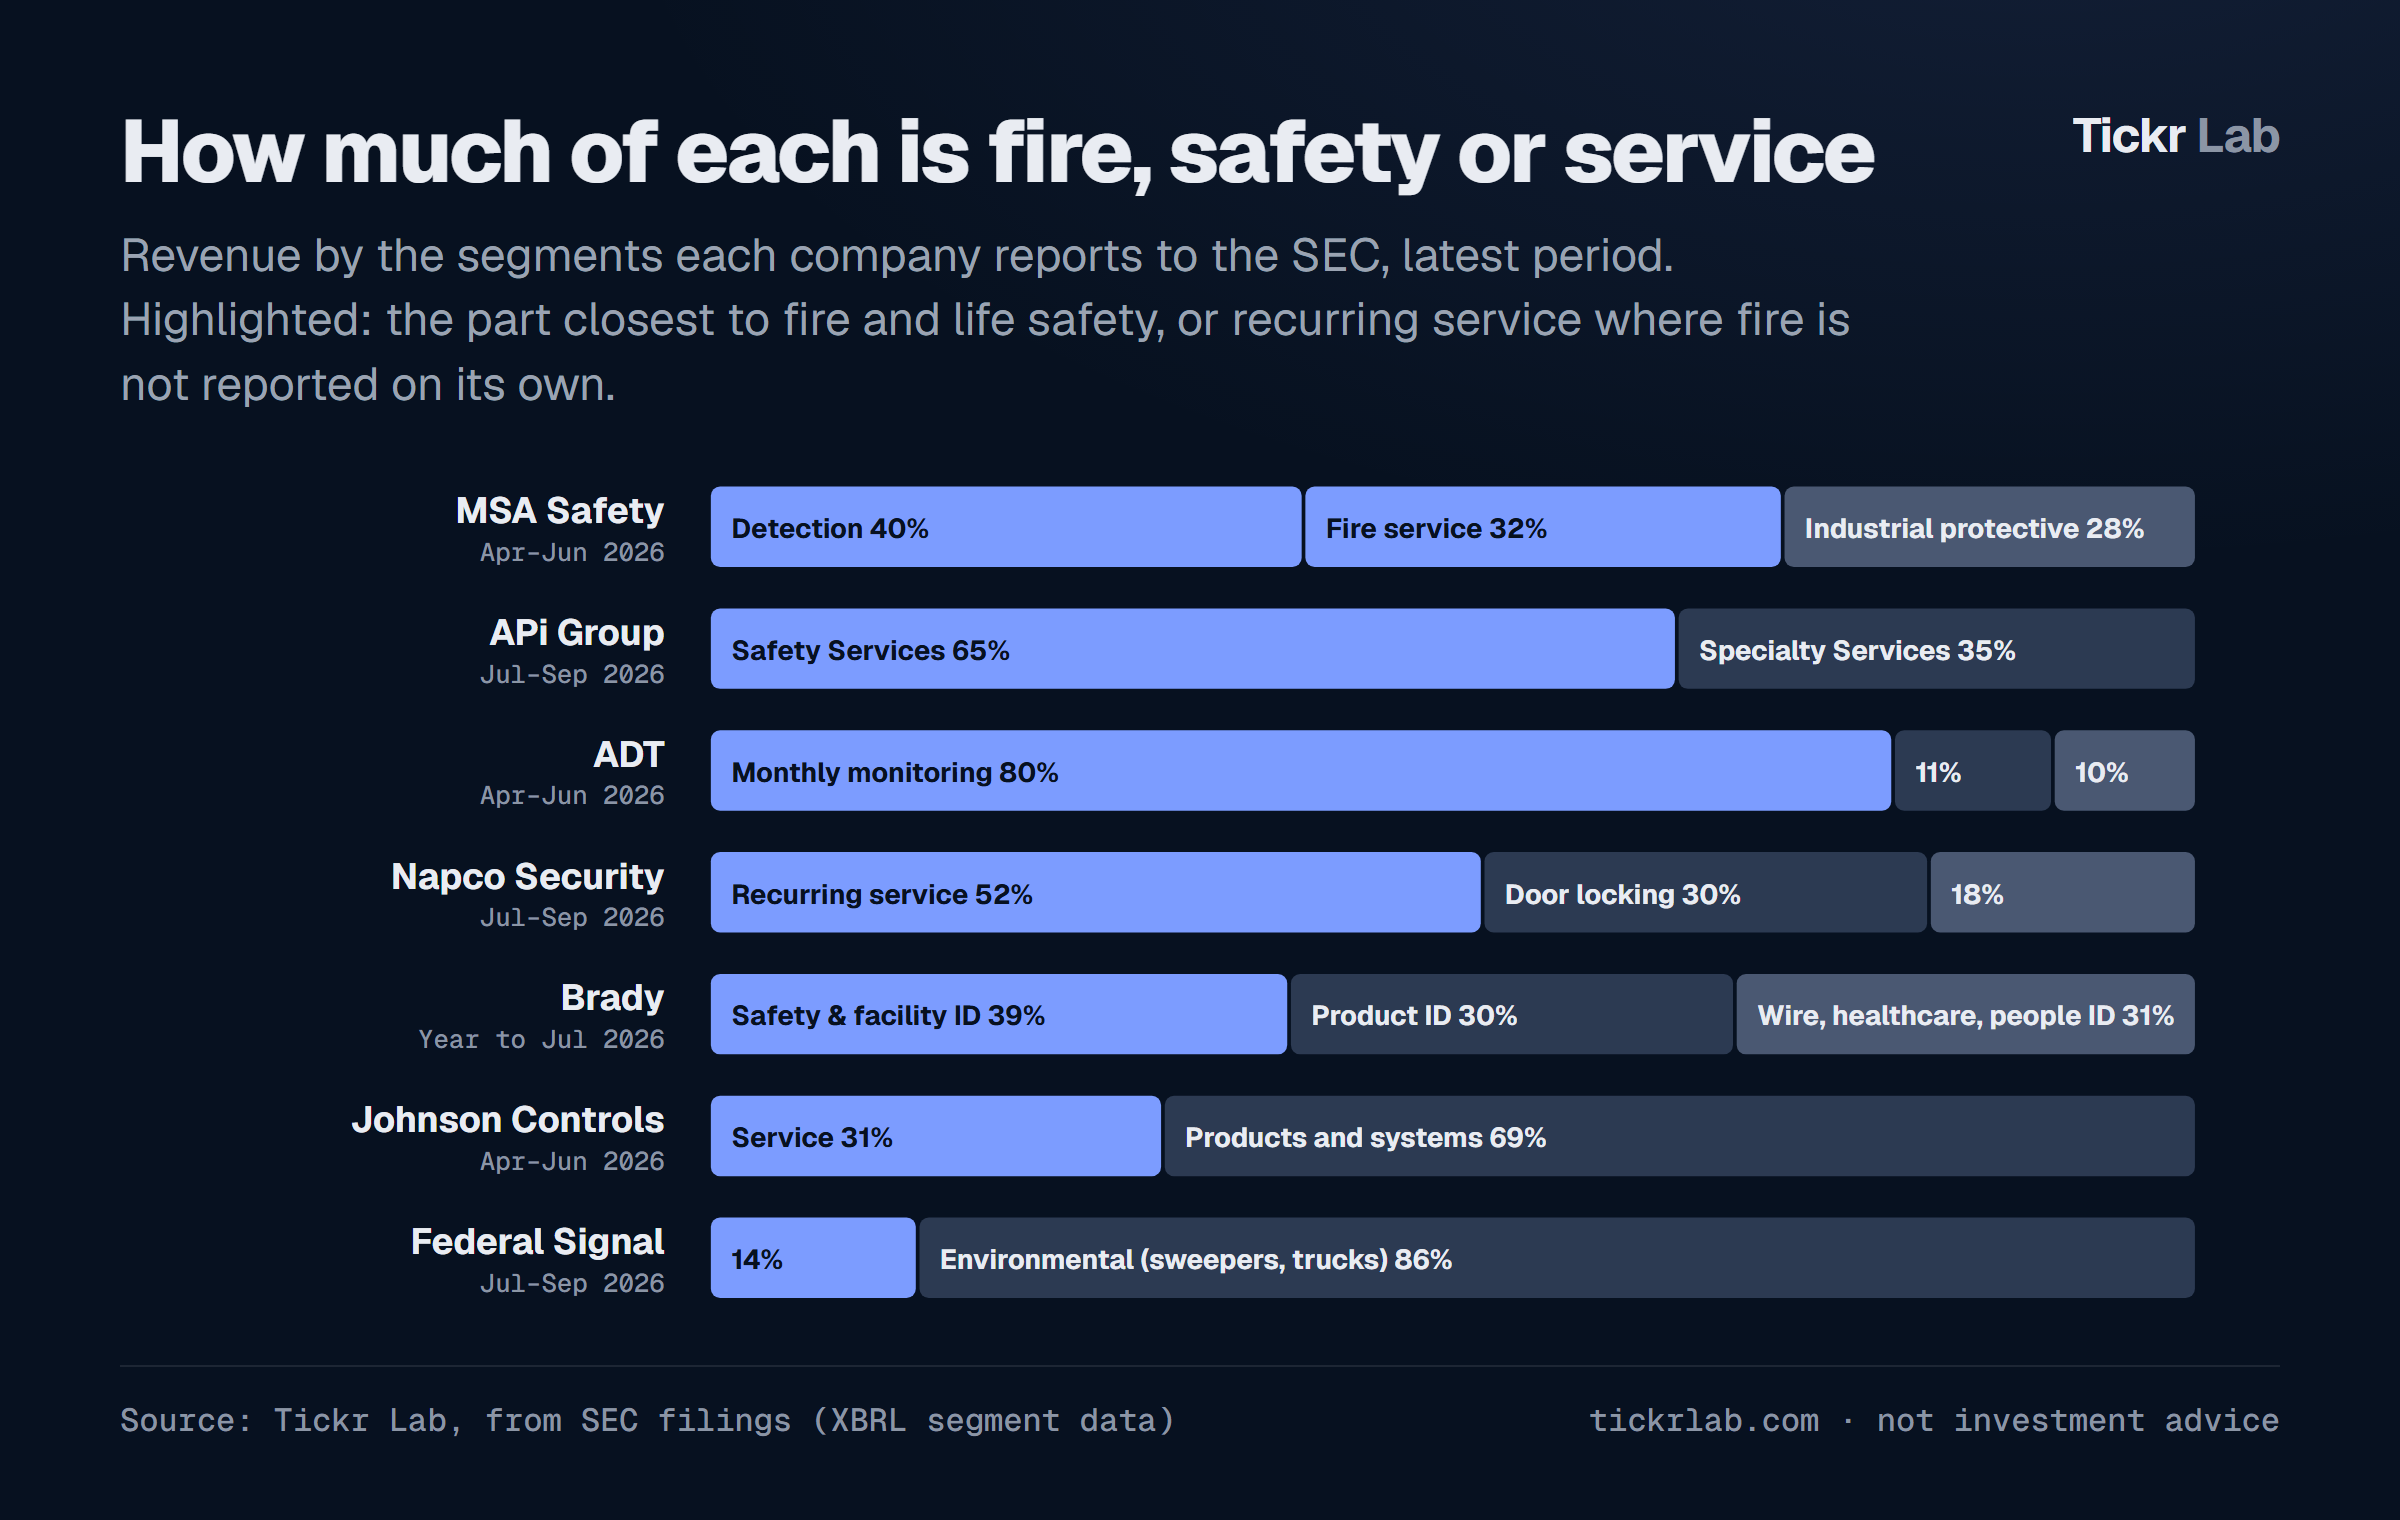
How much of each company is actually fire and safety varies widely, and the segments they report to the SEC show it. MSA Safety is the most concentrated: detection (40%) and fire service (32%) made up 72% of its April to June 2026 revenue, before Autronica. APi Group's Safety Services was 65% in July to September. ADT took 80% of its revenue as monthly monitoring fees and Napco Security 52% as recurring service. Brady's safety and facility identification products were 39% of its year to July. Johnson Controls does not report fire separately. At Federal Signal, safety and security systems were 14%: most of its revenue is street sweepers, vacuum trucks and other environmental vehicles, so it belongs on this list only in part.
Who owns the shares
The SEC filings also show who holds these companies, which matters for anyone thinking about a take-private or a sale:
- ADT: State Farm, the insurer, owns 19.7% and files as an active holder (a Schedule 13D). BlackRock reported 10.3% and Vanguard 8.5%. Any vote on the take-private starts with them.
- APi Group: co-founder Sir Martin Franklin reported 11.5% in May 2026, also on a 13D. In the 13F reports for the June quarter, Fidelity's holding rose from 5.0 million to 17.5 million shares, and 578 managers held the stock, eight more than in March.
- Napco Security: BlackRock reported 15% in April 2026; Copeland Capital reported 5.8% in October.
- Brady: Fidelity reported 15%.
- Johnson Controls: Dodge & Cox reported 9.4% and BlackRock 7.8%.
The nine as a group
Tickr Lab's Fire & Safety theme page measures the nine listed companies together. Four of its charts, as they stood at midday on November 4, 2026:
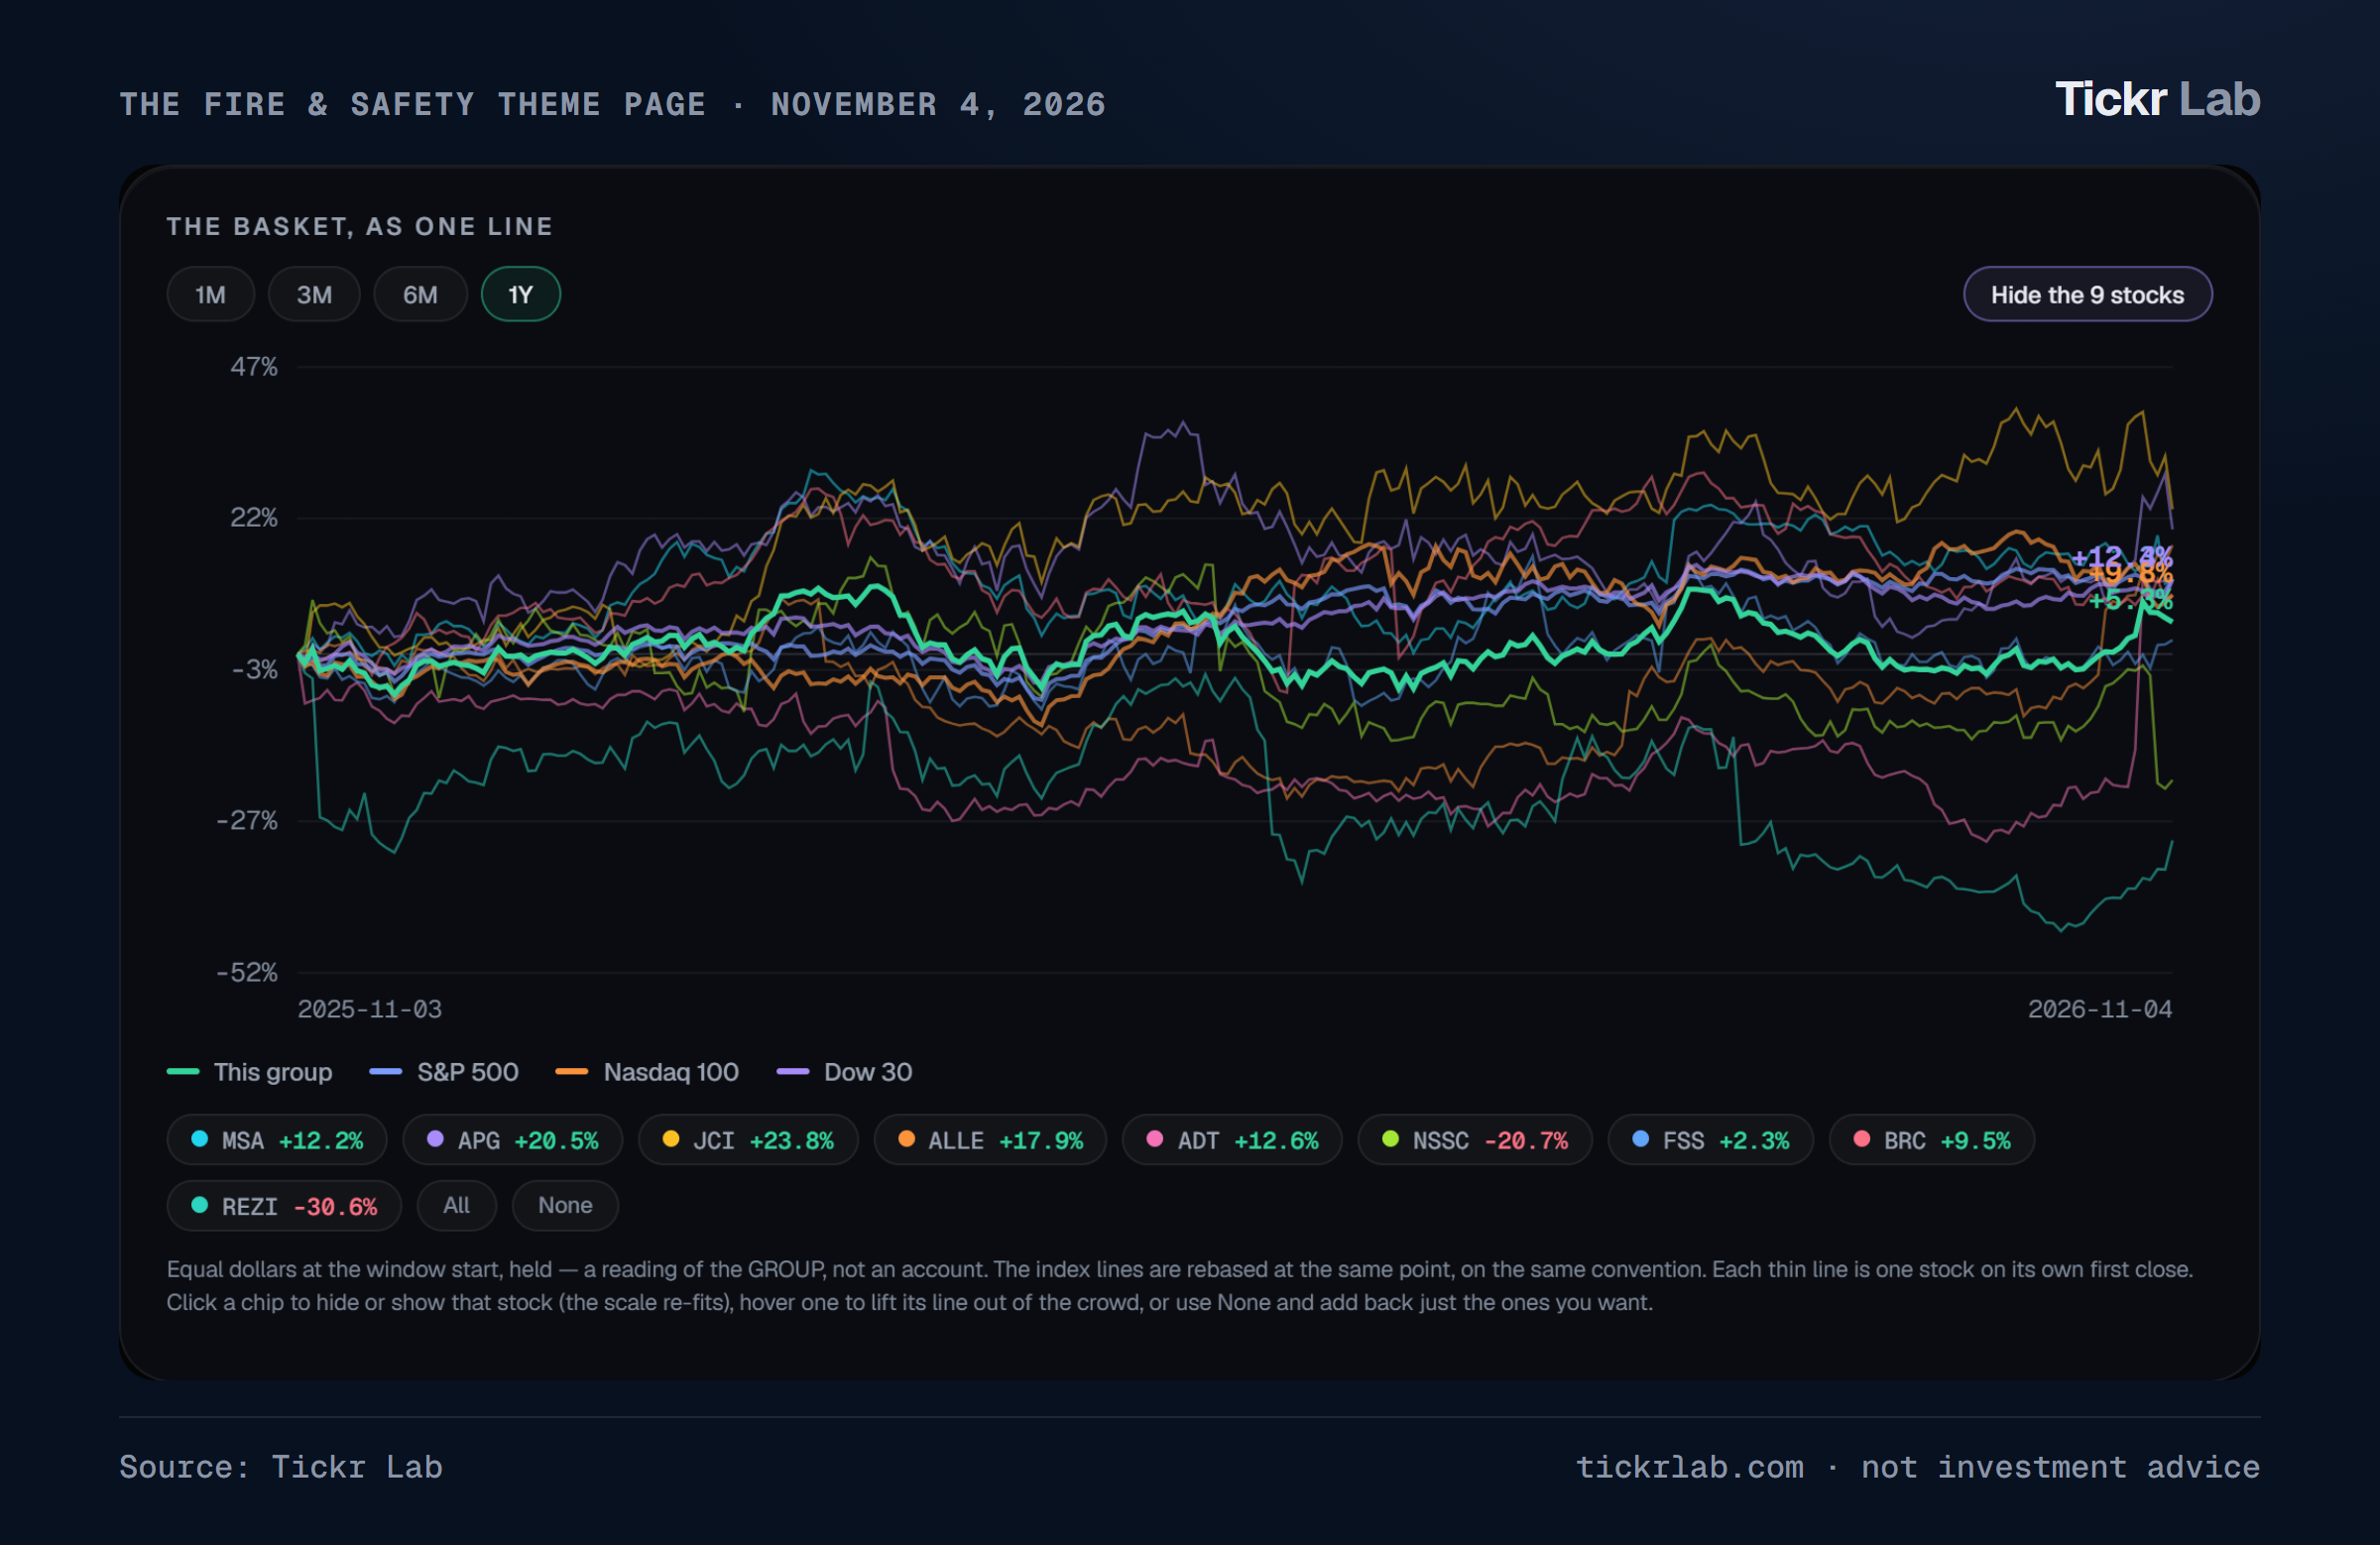
Over the past year, the same amount put into each of the nine would be up 5.3%, against 12.3% for the S&P 500 fund. The average hides a wide spread. Johnson Controls rose 23.8%, APi Group 20.5% and Allegion 17.9%. Napco Security fell 20.7%, and Resideo 30.6% (its price history is adjusted for the August spin-off of its distribution business).
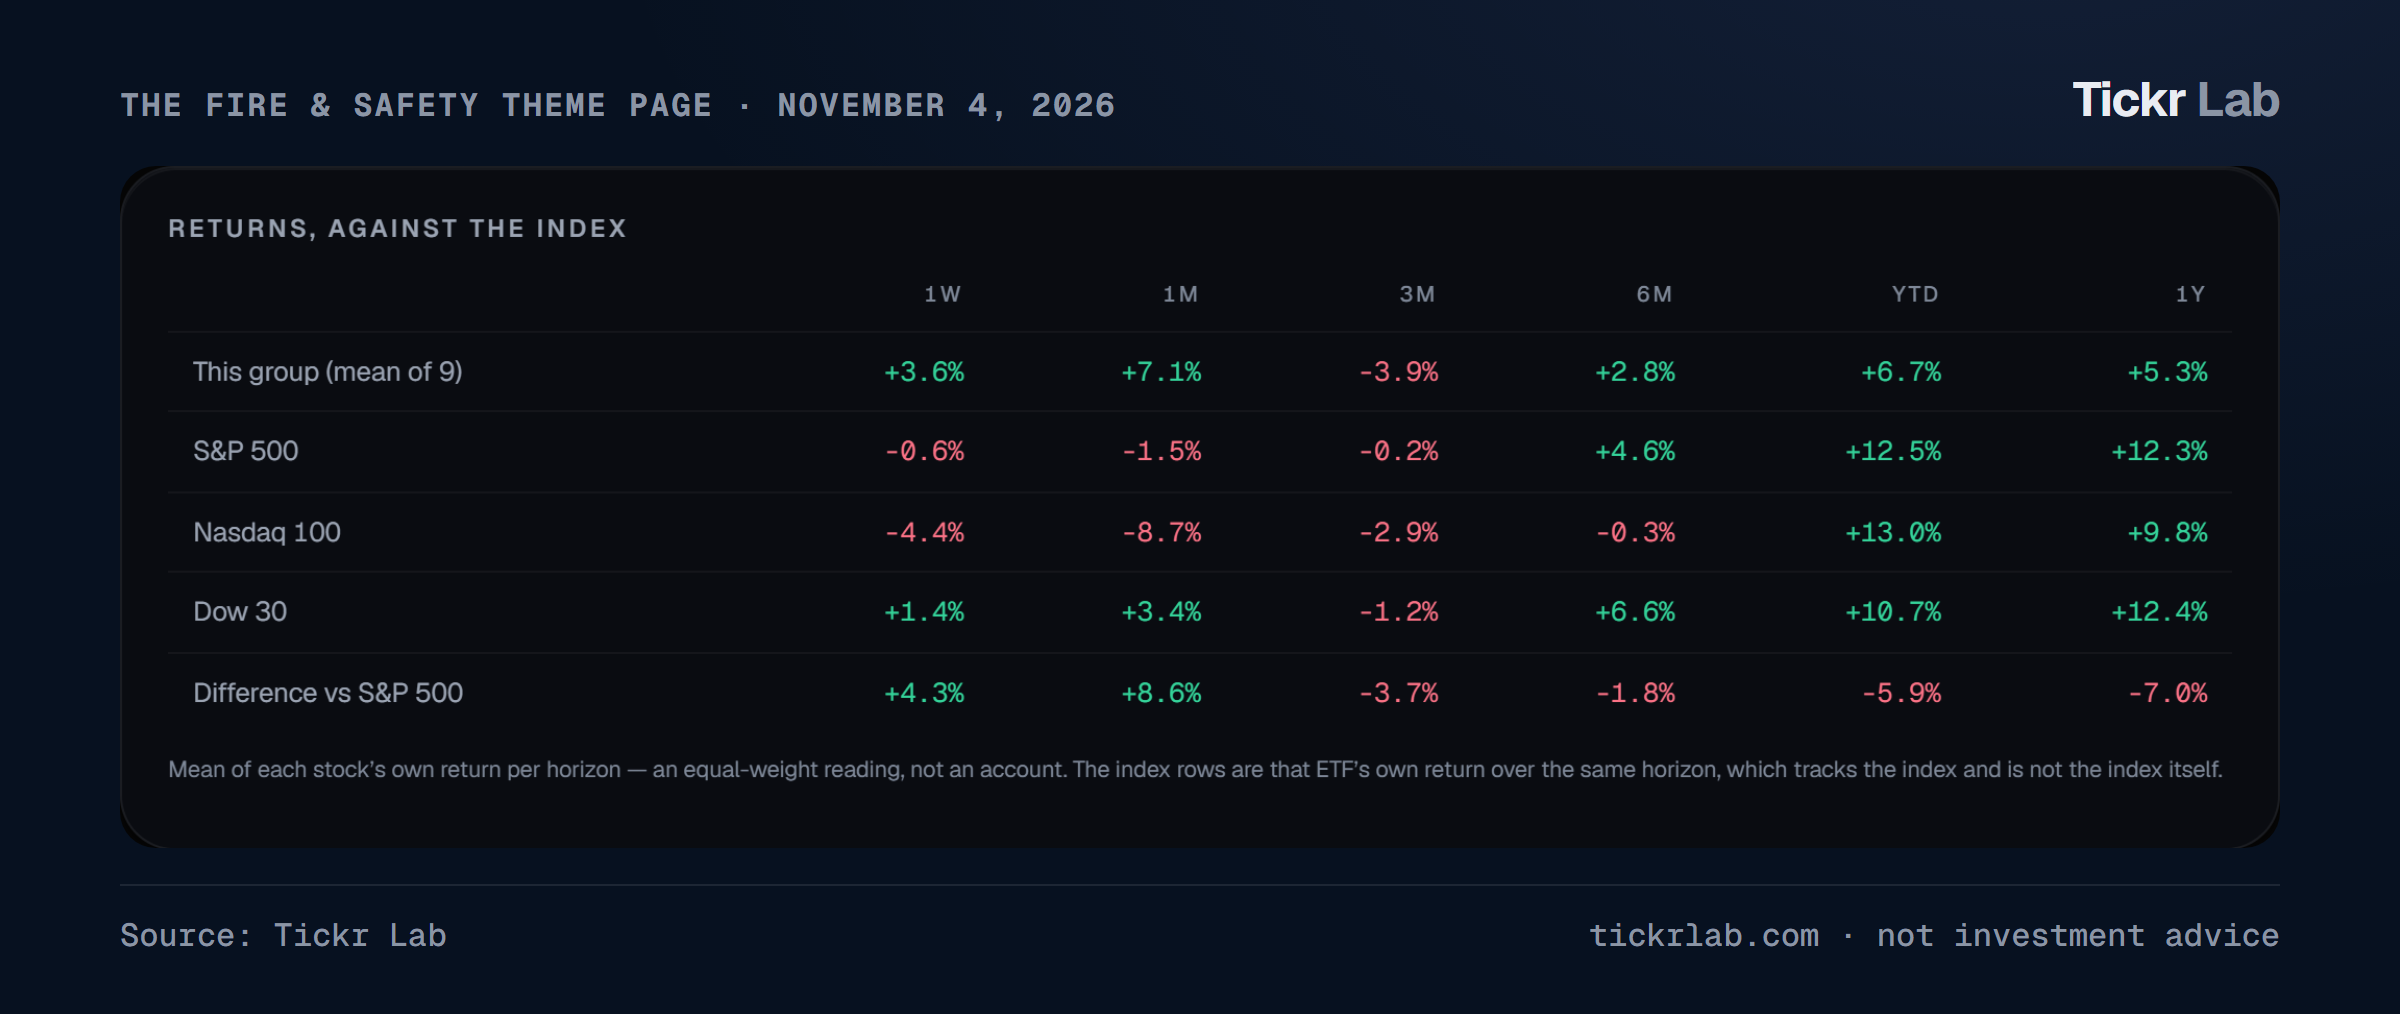
The last month ran the other way. The group rose 7.1% while the S&P 500 fund fell 1.5%, across a results season in which APi, Allegion and MSA reported and ADT agreed its sale at a 45.6% premium. Over the year to date it is still 5.9 points behind.
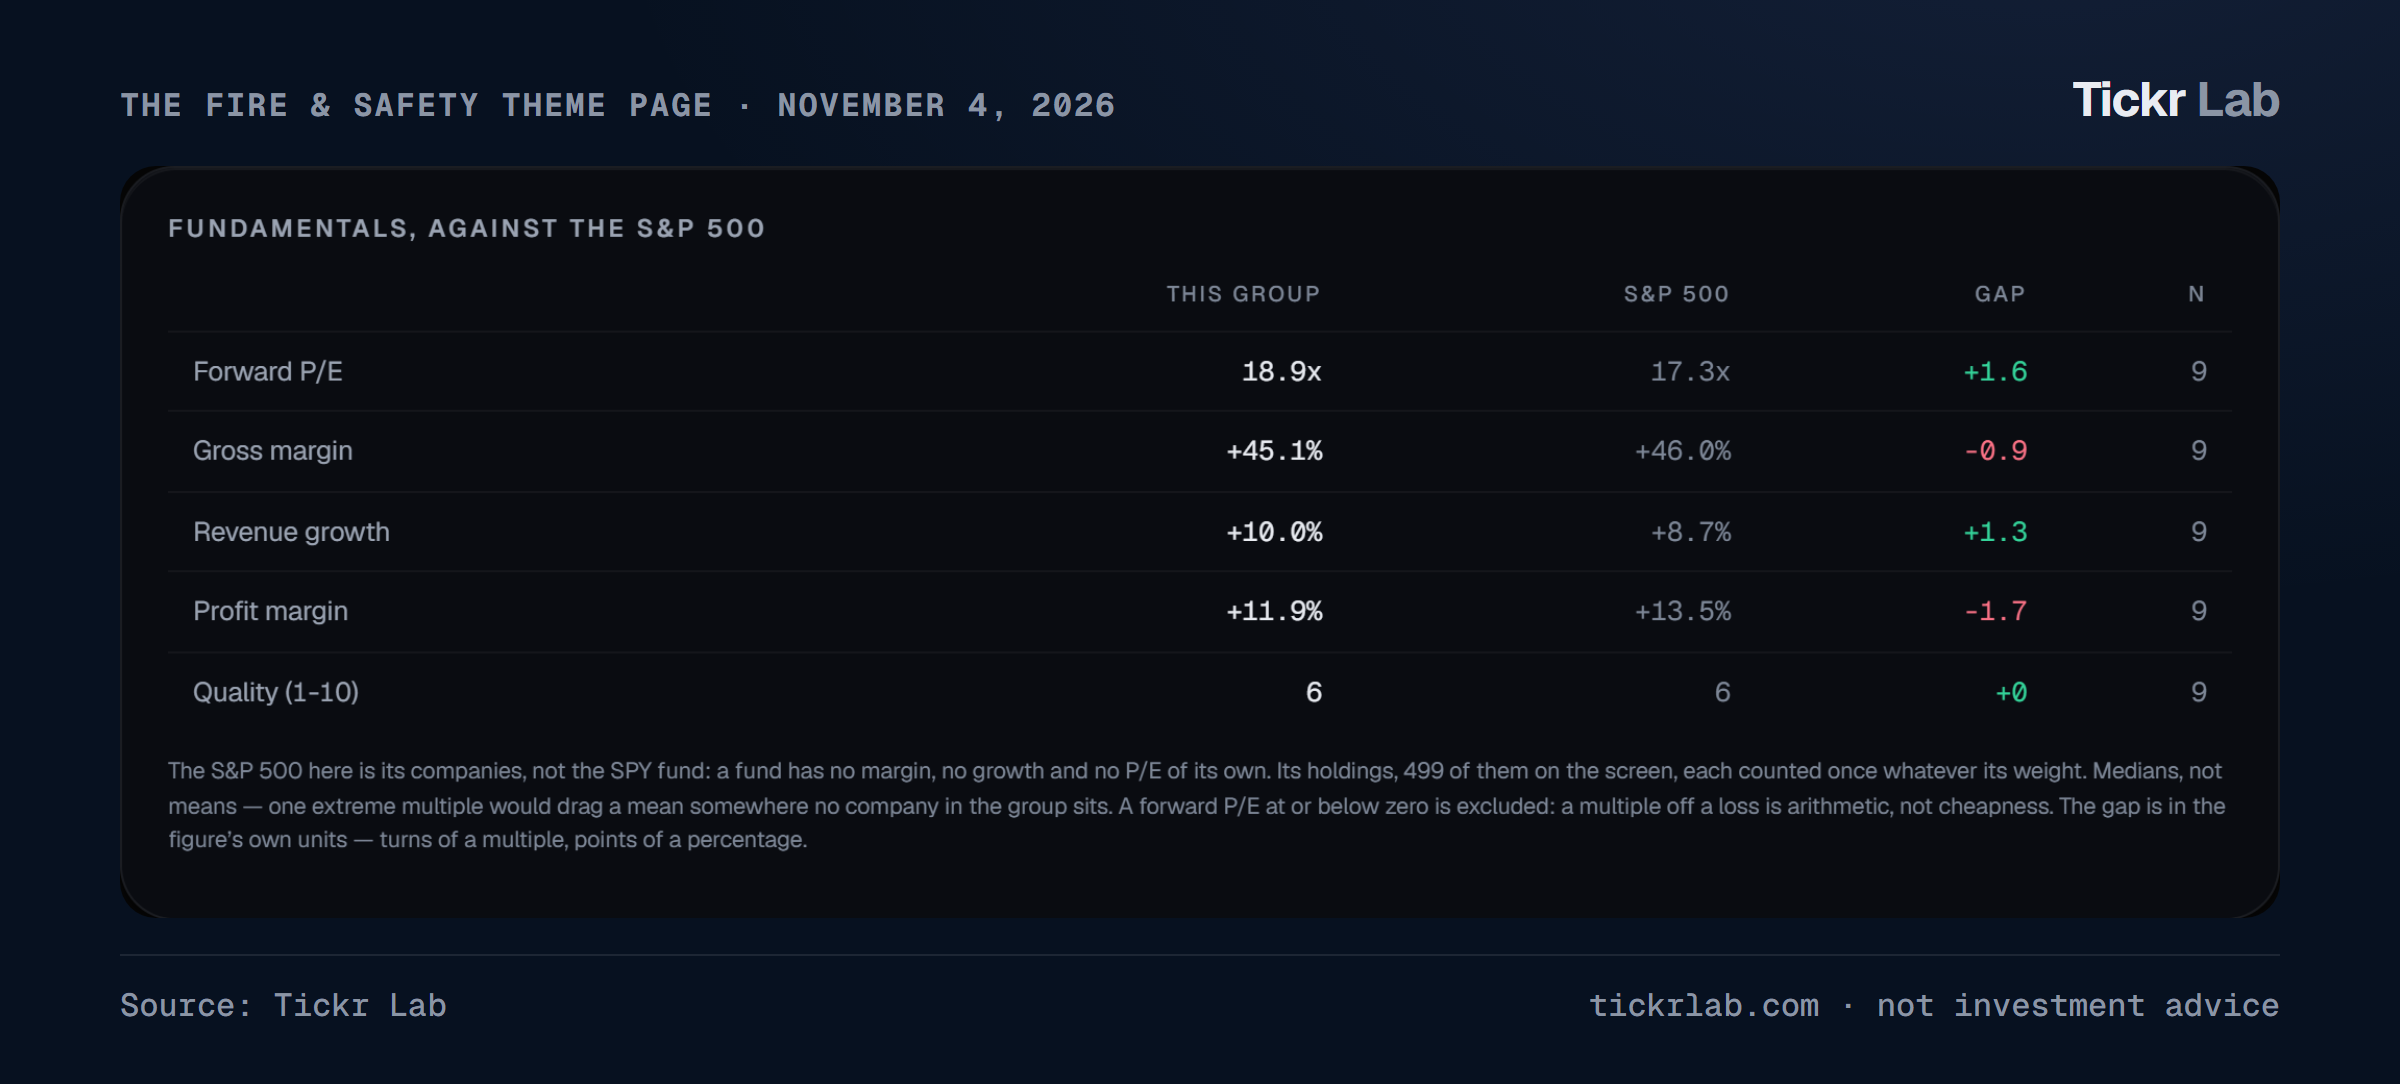
Against the companies of the S&P 500, the typical member of the group grows a little faster (revenue up 10.0% against 8.7%, medians) and is a little less profitable (an 11.9% profit margin against 13.5%), and the market pays slightly more for its expected earnings: 18.9 times against 17.3. On these medians, fire and safety is priced as a steady grower, not as a premium business.
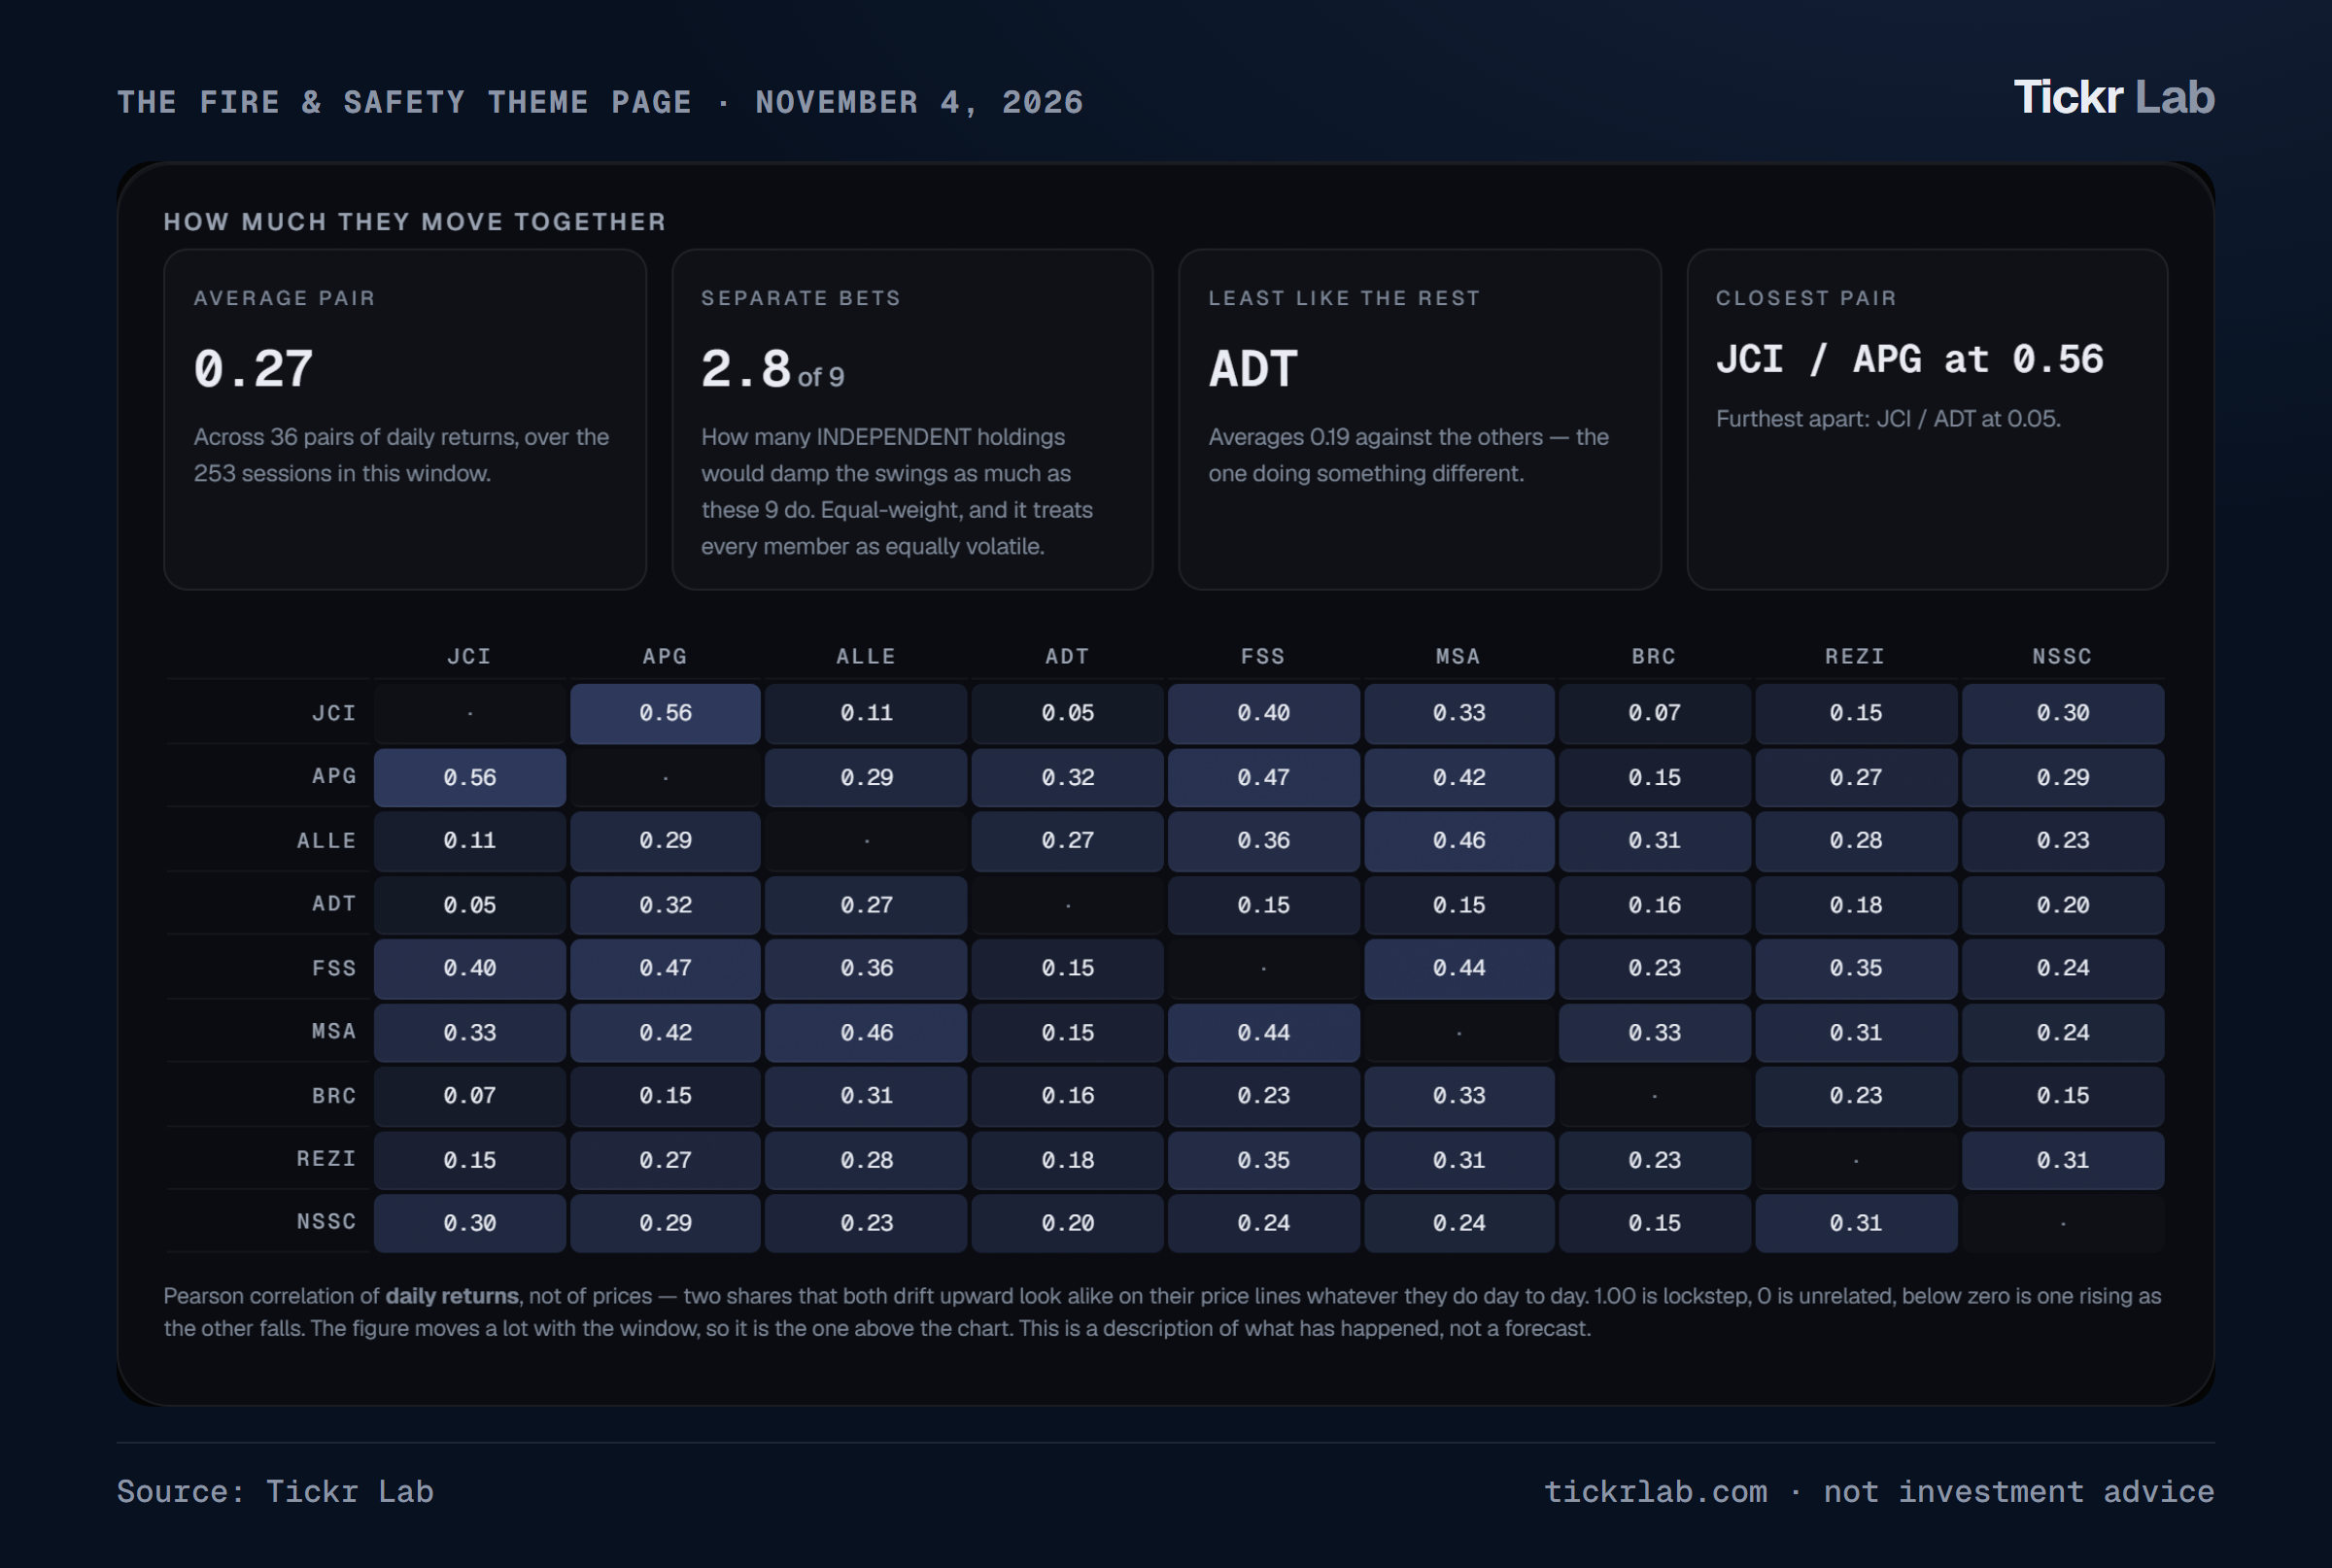
The nine barely move together. The average pair's daily returns correlate at 0.27; the closest pair, Johnson Controls and APi, both building-services businesses, at 0.56; Johnson Controls and ADT at 0.05. As a portfolio the nine behave like 2.8 independent holdings. The stock market does not treat "fire and safety" as one trade: commercial buildings, home monitoring, industrial safety equipment and municipal vehicles each answer to their own customers. A private roll-up that buys across those end markets is buying the same variety.
Resideo, maker of First Alert smoke and carbon monoxide alarms, is left out: it spun off its ADI distribution business on August 3, 2026, and its twelve-month figures still include it. All nine are on the Tickr Lab screener in the Fire & Safety theme.
None of this says what any of these companies, or any private fire business, is worth tomorrow. It is a description of how the industry makes money, how its deals have been priced, and what the people doing them look at, measured from public figures and the brokers' own descriptions of the market.
Listed company figures are from Tickr Lab's own data. Enterprise value is the November 4 share price times shares outstanding, plus debt less cash at the latest quarter end, from the companies' SEC filings and results releases (ADT's and MSA's from their September releases). Adjusted EBITDA is each company's own figure for its four quarters to September 2026, read from its results releases; companies define it differently, so the multiples compare like with like only roughly. Revenue, growth and margins follow Tickr Lab's source rule: the results release while it is the newest, the SEC filing once it is. Segment shares are from the XBRL data in the companies' 10-Q and 10-K filings. The group charts are from the Fire & Safety theme page: returns use the index funds (SPY, QQQ, DIA) for the indexes, and the S&P 500 comparison uses medians of its member companies on the screener. Holdings are from Schedule 13D and 13G filings and the 13F reports for the quarter to June 30, 2026. APi's history is from its results releases as first reported; its fourth quarter of 2023 is the full year less the first three quarters. The Autronica multiple is worked out from the price, 2025 sales and adjusted EBITDA margin MSA Safety gave when it announced the deal; ADT's from the $15.3 billion enterprise value in the merger announcement. Private-company multiple ranges are estimates published by brokers (CT Acquisitions, Ad Astra) and in PE Hub's reporting, not disclosed deal terms. Deal details are from the companies' and investors' announcements and SEC filings; acquisition counts are from CB Insights and an industry tally and may differ from the companies' own. Market sizes are from GM Insights, MarketsandMarkets and Arizton, whose definitions differ. Inspection frequencies are as commonly adopted from NFPA 10, 17A, 25, 72 and 96; local rules and code editions vary.